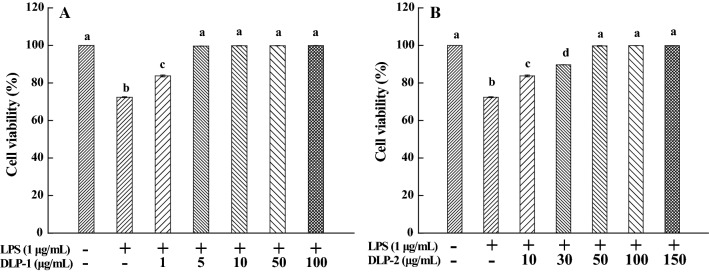
Fig. 2.
Effects of DLP-1 and DLP-2 on cell viability. A Cells were treated with LPS (1 μg/mL) for 24 h in the absence or presence of DLP-1 at different concentrations (1, 5, 10, 50 and 100 μg/mL). B Cells were treated with LPS (1 μg/mL) for 24 h in the absence or presence of DLP-2 at different concentrations (10, 30, 50, 100 and 150 μg/mL). Cell viability was measured using MTT assay. Values were mean ± SD (n = 6); bars with the same letter were not significantly different between groups at P < 0.05, in accordance with Duncan’s multiple range test

