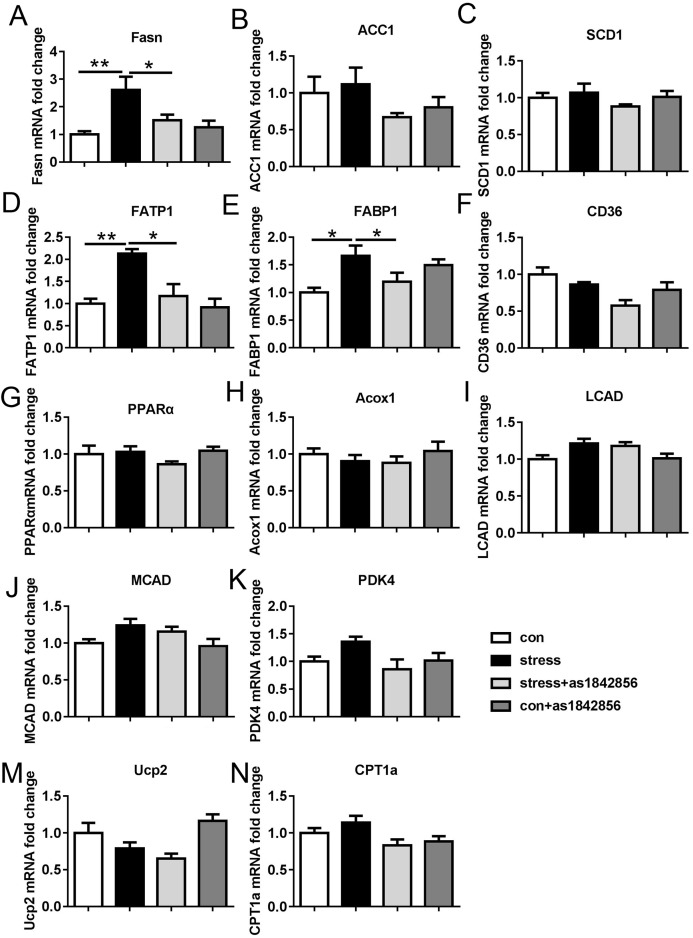
Figure 4. Effects of stress and as1842856 on liver lipid metabolism genes in mice after 6 weeks.
(A–C) Relative mRNA levels of genes involved in hepatic TG synthesis, (D–F) relative mRNA levels of genes involved in fatty acid transport, (G–N) relative mRNA levels of genes involved in fatty acid oxidation. *p < 0.05, **p < 0.01. Date presented as mean ± SEM, n = 6.

