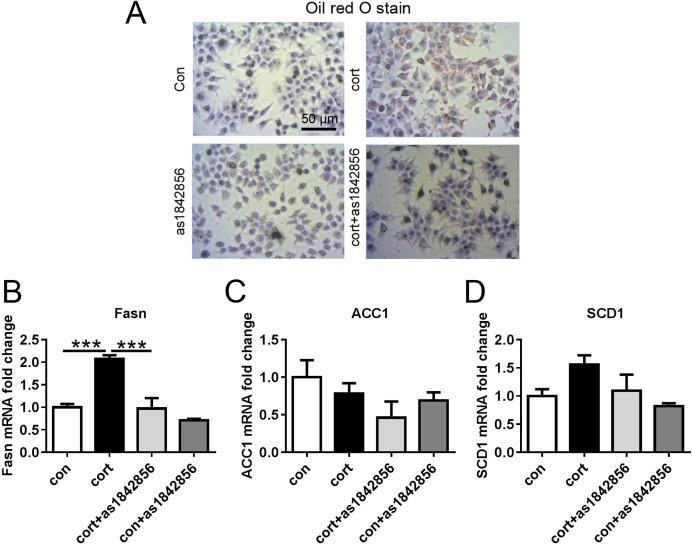
Figure 7. Effects of corticosterone and as1842856 on lipid deposition and TG synthesis genes in Hepa1–6 cells after 48 h.
(A) Representative images showed above from four groups. After treatment with one μm Corticosterone or/and one μm as1842856 for 48 h, the cells were stained with Oil red O. (B) Corticosterone increased the genes’ expression of Fasn, while as1842856 could reverse this effect. (C and D) There was no significant difference among the four groups in the genes’ expression of ACC1 and SCD1. ***p < 0.001. Date presented as mean ± SEM, n = 3.

