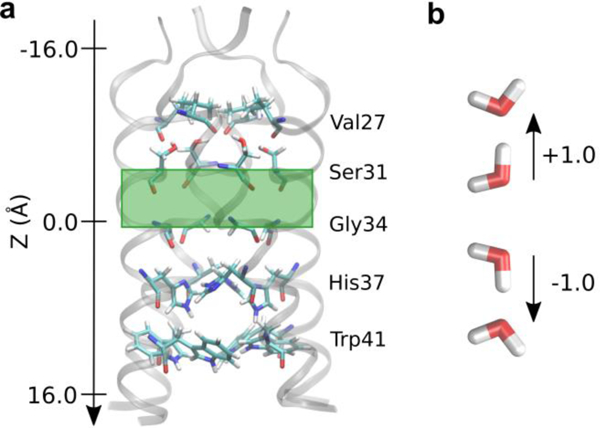
Figure 2.

(a) The M2 channel with pore-lining residues shown as sticks. The green box highlights the region of water analyzed in Figure 3a. The direction of the z-axis indicates the direction of proton flux from the exterior to the viral interior. (b) Definition of hydrogen bond directions, with respect to the channel as shown, used throughout.
