
Figure 3.
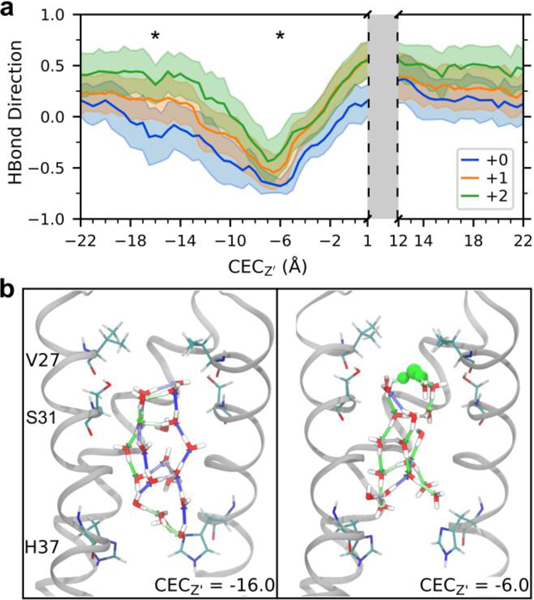
Hydrogen bond rearrangement as proton moves through the channel. (a) Average and standard deviation of the direction of water-water hydrogen bonds in the central region of M2 (see green box in Figure 2a) as a function of CEC position. (b) Example water structures in the middle region of the +1 channel for CECZ’ = −16.0 (the proton is near the entrance of the channel, not in view) and −6.0 Å (above this central region – see stars in 3a). Hydrogen bonds are shown as arrows, colored as a gradient based on direction where blue is +1.0 and green is −1.0. The most hydronium-like water is shown in green. Front helix and residues on back helix are removed for clarity.