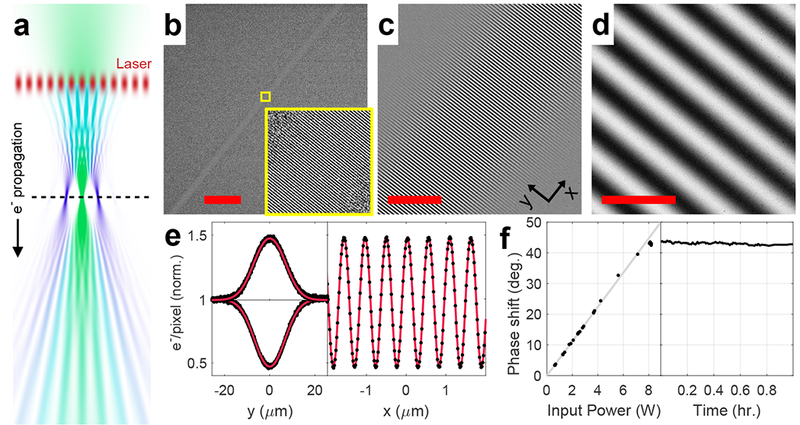
Fig. 2. Electron micrographs of a standing laser wave.

(a) Simulation of the electron beam propagation in the experimental setup for imaging light waves. The horizontal scale is exaggerated relative to the vertical scale. Top to bottom: a converging Gaussian electron beam (green) is diffracted by the laser standing wave acting as a phase grating (red), which generates density modulation in the electron beam (teal) as it propagates downstream from the laser wave. At the focal plane of the unscattered electron beam (dashed line), the diffraction orders spatially separate, each forming an isolated focal point. As the diffraction orders expand beyond their focal points, they overlap again and their interference pattern forms a Ronchigram image of the light wave in the far-field. The hue of the electron beam represents the fraction of diffracted (blue) or undiffracted (green) wave function amplitudes. (b-d) Electron micrographs of the intra-cavity standing laser wave at different magnifications. Scale bars: (b), 100 µm; (c), 10 µm; (d), 1 µm. The inset in (b) shows a magnified view of the region indicated by the yellow square. The coordinate axes annotation in (c) shows the axes used in (e). (e) Averaged transverse (left) and longitudinal (right) profiles of the standing wave image shown in (d) (black dots) with the fitted model (red lines). The transverse profile is shown for both the positive fringe in the image (upper curve) and the negative fringe (lower curve). The longitudinal profile is averaged over a narrow region along the central axis of the laser wave (see Supplementary Note 1). (f) The phase shift at the antinode of the light wave as a function of the input power (left) and time (right). The gray line in the left graph shows a linear least squares fit to the data.
