
Figure 3. Linear model predicts cortical activity with highly specific model variables.
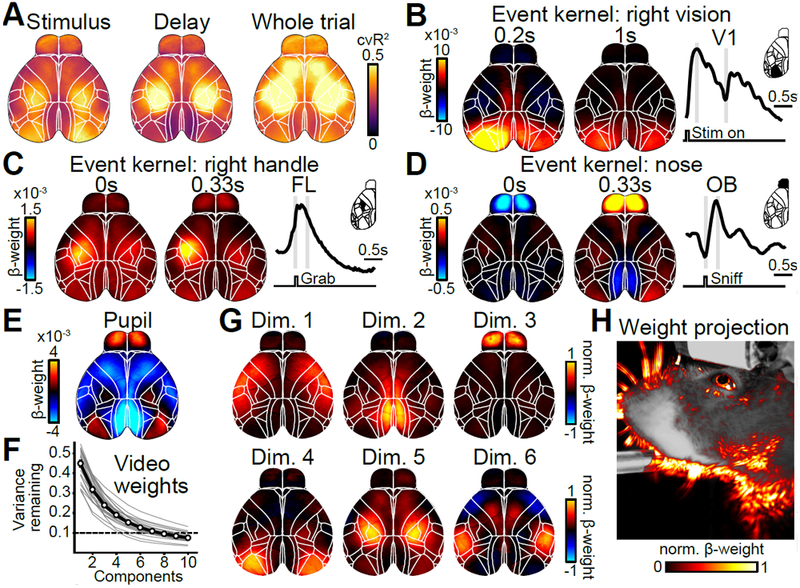
(A) Maps of cross-validated explained variance for two task epochs and the whole trial. (B) Example weight maps of the event kernel for right visual stimuli, 0.2 and 1 seconds after stimulus onset. Trace on the right shows the average weights learned by the model for left V1. Gray lines indicate times of the maps on the left. (C) Same as in (B) but for the event kernel corresponding to right handle grabs, 0 and 0.33 seconds after event onset. (D) Same as in (C) but for the event kernel corresponding to nose movements in the olfactory bulb (OB). (E) Weight map for the analog pupil variable. (F) Cumulative remaining variance for PCs of model’s weight matrix for all video variables. Black line shows session average, gray line individual sessions. On average, >90% of all variance was explained by 8 dimensions (dashed line). n=22 sessions. (G) Widefield maps corresponding to the sparsened top 6 video-weight dimensions for an example session. (H) Influence of each behavioral video pixel on widefield data. The opacity and color of the overlay were scaled between the 0th and 99th percentile over all beta values.