
Figure 4. Uninstructed movements dominate cortical activity.
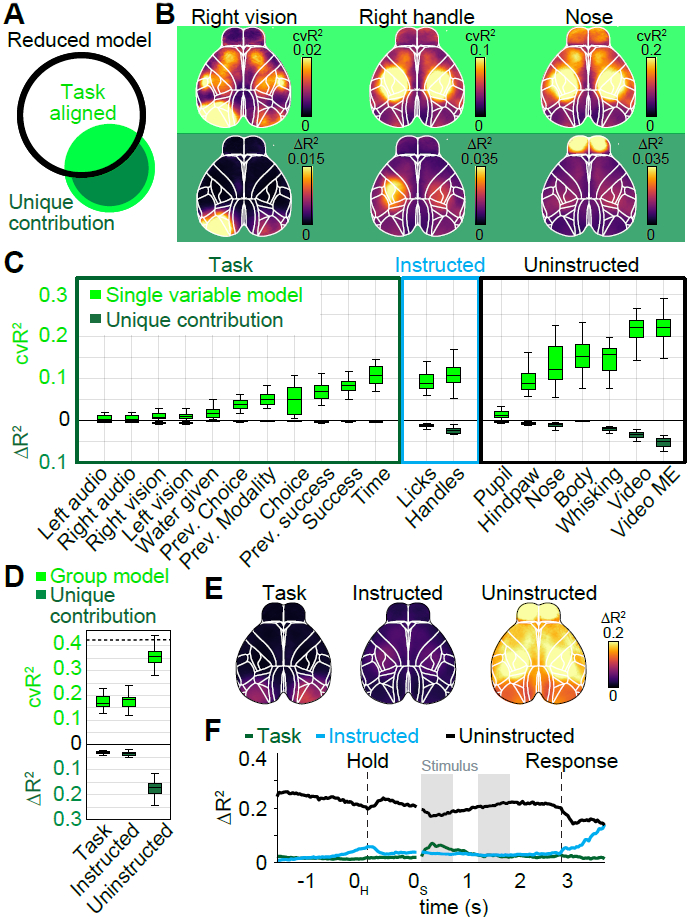
(A) Black circle denotes information of a reduced model, lacking one variable. The single variable (green circle) has information that overlaps (light green) with the reduced model and a unique contribution (dark green) that increases the full model’s information. (B) Top row: Cross-validated explained variance (cvR2) maps for different single-variable models. Bottom row: Unique model contribution (ΔR2) maps for the same variables. (C) Explained variance for single model variables, averaged across cortical maps. Shown is either cvR2 (light green) or ΔR2 (dark green). The box shows the first and third quartiles, inner line is the median over 22 sessions, whiskers represent minimum and maximum values. Prev.: previous. (D) Explained variance for variable groups. Conventions as in (C). (E) ΔR2 map for each variable group. (F) ΔR2 for variable groups at each time-point, averaged across cortex. (B-F) (n=22 sessions).