
Figure 5. Uninstructed movements make considerable task-aligned and task-independent contributions.
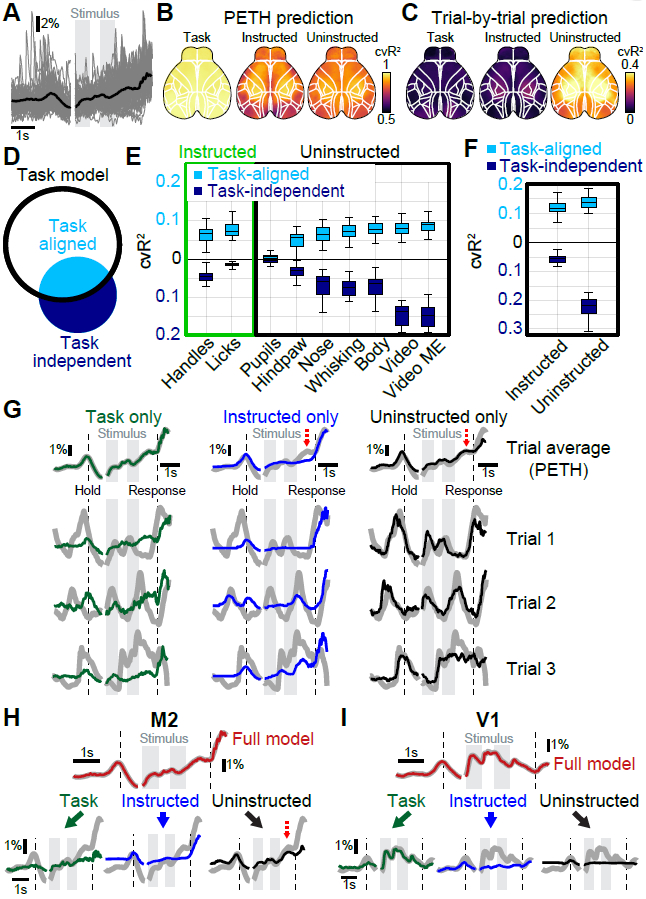
(A) Example M2 data from a single animal. Black trace shows average over all trials, thin gray traces activity from 100 randomly selected trials. (B) Predictions of trial-average by different models that were based on a single variable group. Maps show cvR2 after averaging over all trials. (C) Predictions of trial-by-trial variability. Maps show cvR2 after averaging over all time-points within each trial. (D) Black circle denotes task-model information. A movement variable (blue circle) has information that overlaps with the task (light blue) and information that is task-independent (dark blue). (E) Explained variance for all movement variables. Shown is task-independent (dark blue) and task-aligned explained variance (light blue). Values averaged across cortex. The box shows the first and third quartiles, inner line is the median over 22 sessions, whiskers represent minimum and maximum values. (F) Task-aligned and task-independent explained variance for movement groups. Conventions as in (E). (G) M2 data (gray traces), predicted by different variable group models. PETHs (top row) are mostly well-explained by all three models. Single trials were only well predicted by uninstructed movements (right column, black). (H) The M2 PETH is accurately predicted by the full model (top trace, red). Reconstructing the data based on model weights of each variable group allows partitioning the PETH and revealing the groups’ respective contributions to the full model (bottom row). Red dashed arrow indicates an example PETH feature that is best-explained by uninstructed movements. (I) Same as in (H) but for V1 data. (A, G-H) (n=412 trials).