
Figure 6. Cognitive and movement responses during learning.
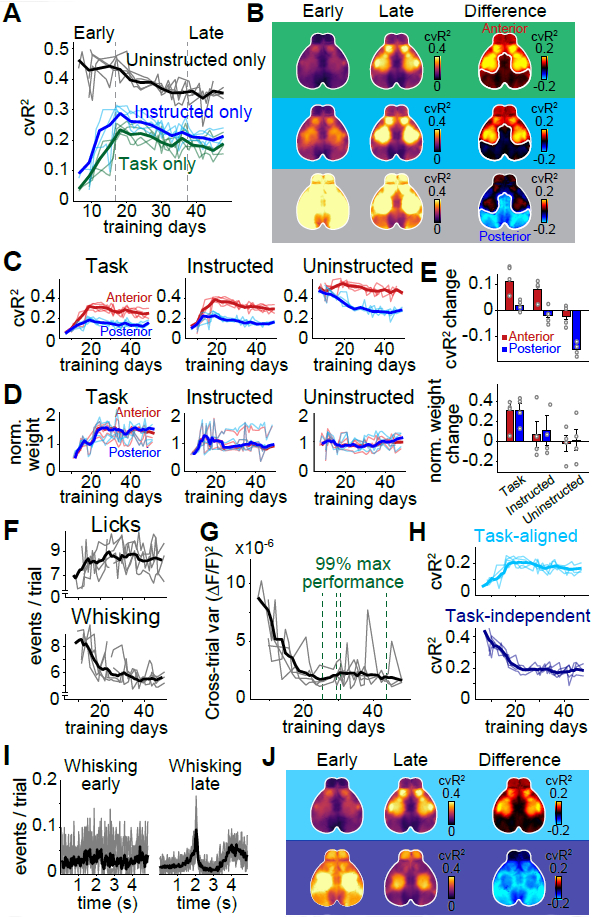
(A) cvR2 for uninstructed movement (black), task (green) and instructed movement (blue) models, from early to late in training (dashed lines). (B) cvR2 maps for each model, either early (left column) or late (middle column) in training. Right column shows the difference between early and late cvR2. White outlines show separation between ‘anterior’ and ‘posterior’ cortex, which behaved differently with regard to cvR2 change. (C) Changes in cvR2 for anterior (red) and posterior (blue) cortex for each model and training day. (D) Same as in (C) but for the sum of absolute weights in each model. Each model weight was normalized to the early training period. (E) Difference between early and late training data for cvR2 (top) and model weights (bottom). Error bars show the SEM. (F) Mean number of behavioral events per trial for each training day. Shown are event rates for licking (top) and whisking (bottom). (G) Trial-by-trial variance in widefield fluorescence across cortex for each training day. Green lines show the time when individual animals reached 99% of their maximum task performance. (H) Task-aligned (top) and task-independent cvR2 (bottom) for uninstructed movements. (I) PETH for whisking early versus late during training. n=10 sessions per condition from one mouse. Thin lines: sessions; thick lines: average. (J) Averaged cortical maps for task-aligned (top row) and task-independent cvR2 (bottom row). Left and middle columns show cvR2 early and late in training, right column shows their difference. Colors indicate the task-aligned contribution (top) or task independent contribution (bottom). (A-H, J) (n=4 mice, thin lines/circles: animals, thick lines/bar plots: mean).