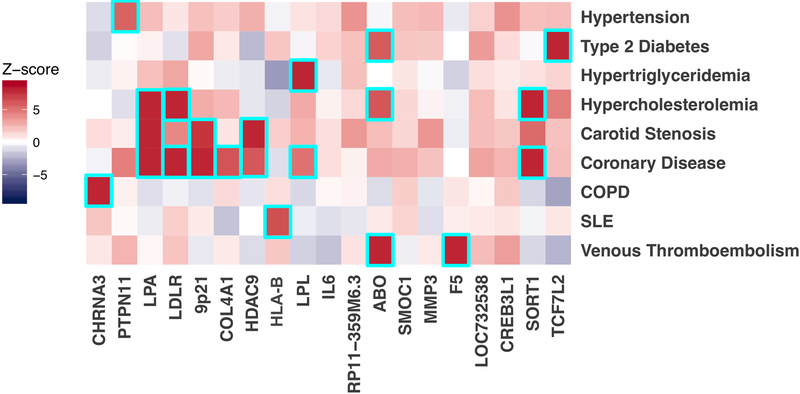
Figure 2. Representative heatmap of phenome-wide association results and biologic pathways underlying genetic loci associated with peripheral artery disease.
Logistic regression Z-scores (aligned to the PAD risk allele) from the MVP PheWAS analysis (N = 176,913) or publically available PheWAS results from PhenoScanner 2.0 (variable N, see Supplementary Table 23) are shown for the associations between the 19 PAD risk loci and representative disease traits. A positive Z-score (red) indicates a positive association between the PAD risk allele and the disease, whereas a negative Z-score (blue) indicates an inverse association. Boxes are outlined in cyan if the variant is associated with the indicated disease at genome-wide significance (logistic regression two-sided P < 5.0 ×10⁻⁸).
Abbreviations: COPD, chronic obstructive pulmonary disease; SLE, Systemic Lupus Erythematosus

