Figure 5.

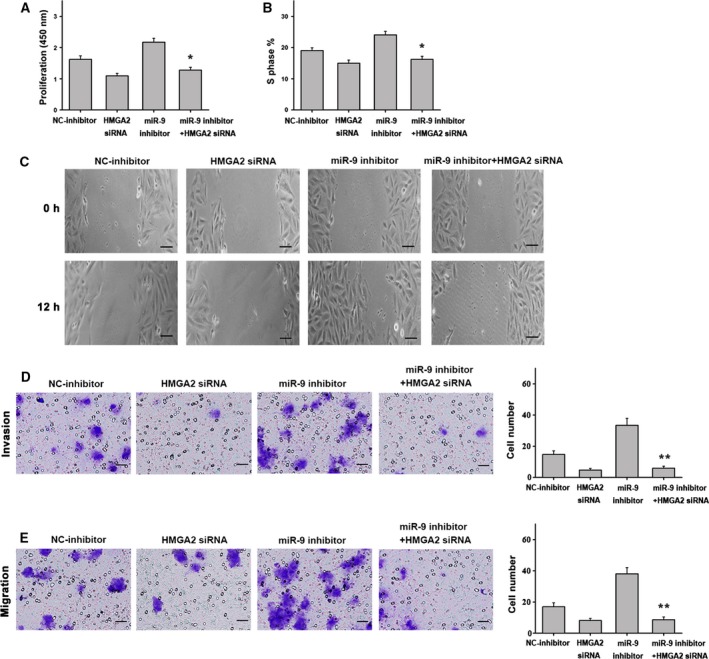
Effect of miR‐9 inhibitor in HCC cells. (A) Cell proliferation was increased in HCC cells transfected with miR‐9 inhibitor when compared with the controls. The opposite results were observed in cells treated with the miR‐9 inhibitor plus HMGA2 siRNA. (B) Cells transfected with the miR‐9 inhibitor showed an increase in the number of cells entering S phase, whereas treatment with the miR‐9 inhibitor plus HMGA2 siRNA exerted the opposite effect. (C) Representative images of migrated cells transfected with miR‐9 inhibitor, NC‐inhibitor, HMGA2 siRNA or miR‐9 inhibitor plus HMGA2 siRNA (scale bars: 25 μm). (D) The invasion of cells transfected with the miR‐9 inhibitor, NC‐inhibitor, HMGA2 siRNA or miR‐9 inhibitor plus HMGA2 siRNA (scale bars: 50 μm). (E) The migration of cells transfected with the miR‐9 inhibitor, NC‐inhibitor, HMGA2 siRNA or miR‐9 inhibitor plus HMGA2 siRNA (scale bars: 50 μm). n = 6. *P < 0.05; **P < 0.01. Data were expressed as the mean ± SD, one‐way ANOVA.
