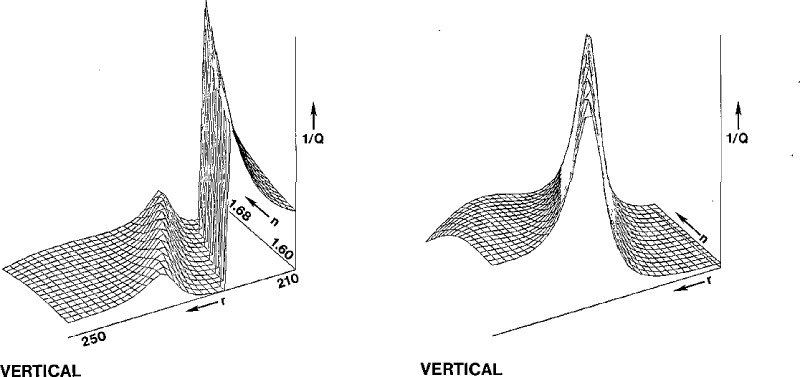
Figure 8–
Plots of 1/Q as a function of n and r that show a ridge of spurious “best” fits for vertical polarization when the experimental intensities are scaled, a ridge that is absent when the theoretical intensities are scaled instead. Simulated data obtained by adding random noise to the calculated intensity.

