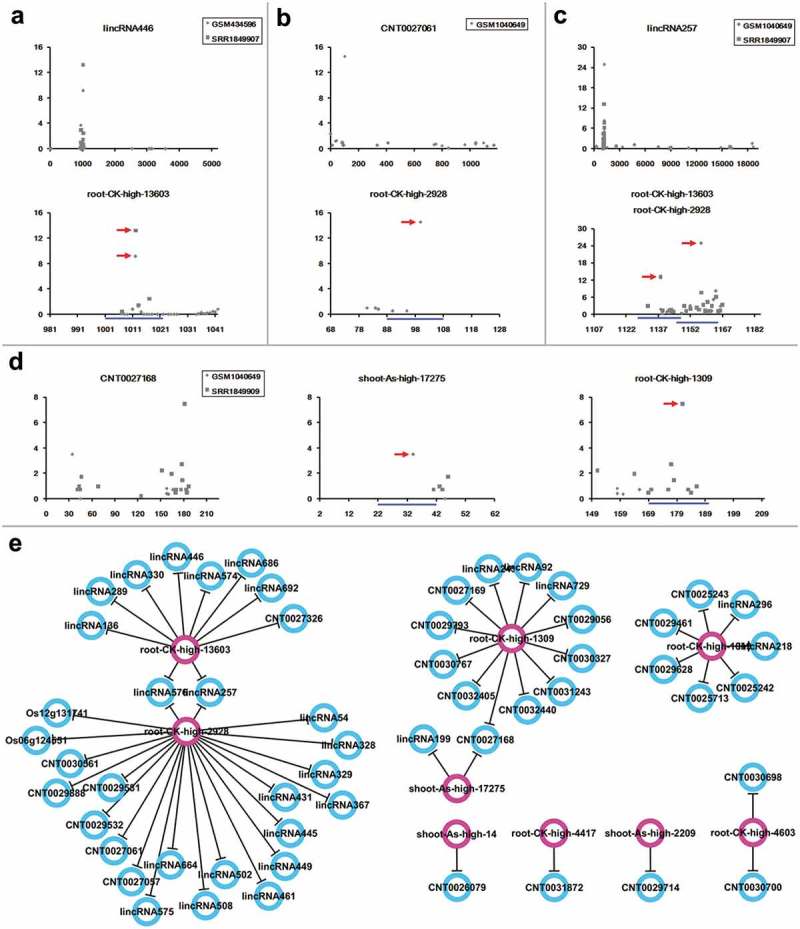
Figure 4.

Regulation of long non-coding RNAs by the arsenic-responsive small RNAs. (a–d) show the examples of small RNA (sRNA)–long non-coding RNAs (lncRNAs) regulation validated by degradome-seq data. For each panel, the first target plot (t-plot) presents the global distribution of degradome signals along the full-length lncRNA, with lncRNA ID and degradome-seq data set IDs shown on the top. The remaining t-plot(s) provide(s) a detailed view of degradome signals surrounding the predicted binding site(s) [blue line(s)] of the arsenic-responsive sRNA(s) [ID(s) shown on the top] on the lncRNA. The result clearly shows the degradome-seq evidence (marked by red arrowheads) supporting the regulatory relationship. For each t-plot, the Y-axis measures the degradome signal intensity in RPM (reads per million), and the X axis indicates the position on the lncRNA. (e) Regulatory network constituted by the sRNA–lncRNA pairs supported by degradome-seq data. Pink circles: regulatory sRNAs; blue circles: lncRNA targets.
