
FIG. 4.
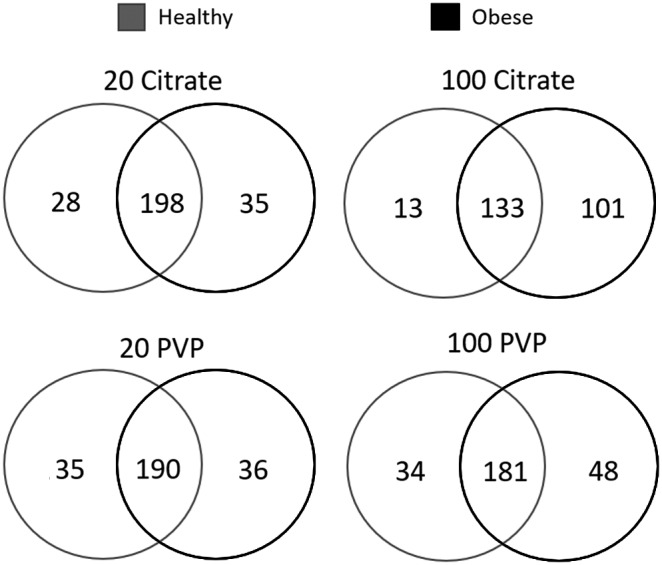
Comparison of BC composition between healthy and obese conditions for all four AuNPs. Proteins identified as present in each AuNP BC formed from healthy serum were compared to proteins within the same AuNP BC formed from obese serum. Venn diagrams were used to illustrate all comparisons. A comprehensive list of all proteins found in each BC is found in Supplementary Table S1. A list of specific proteins used to generate the Venn diagrams in the figure is found in Supplementary Table S5.