
Figure 2.
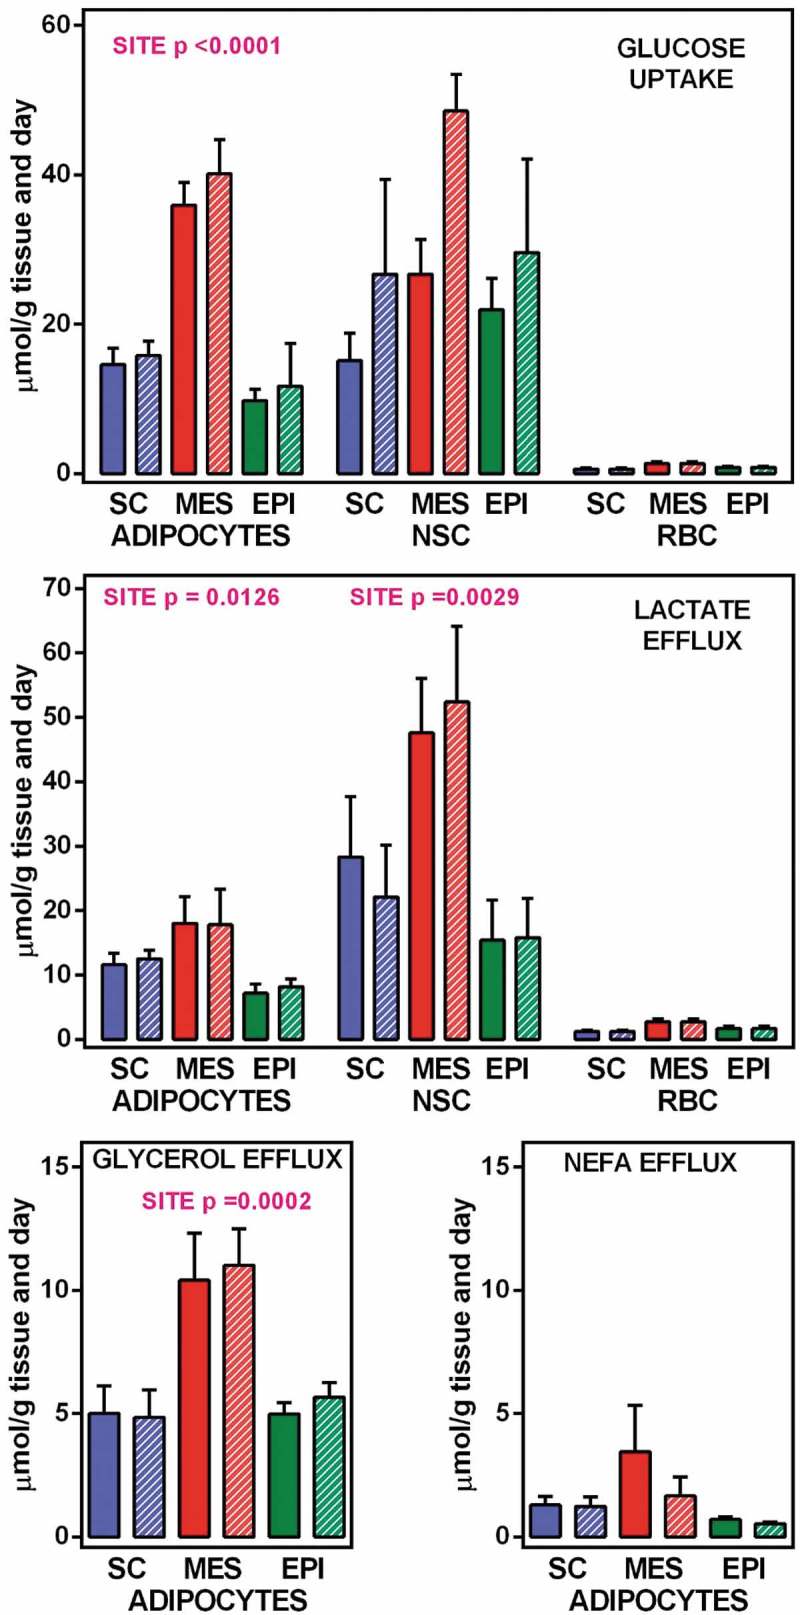
Glucose uptake, and lactate, glycerol and NEFA efflux from WAT component cells corresponding to 1 g of tissue SC = subcutaneous WAT (blue); MES = mesenteric WAT (red); EPI = epidydimal WAT (green). Full columns = 7 mM glucose, white-dashed columns = 14 mM glucose. The data are the mean ± sem of two-rat pooled samples (N = 4; N = 3 for 14 mM glucose in MES and EPI) obtained from adult male rats. The data for glucose uptake and lactate efflux correspond to the number of adipocytes, NSC and RBC contained in 1 g of tissue (Table 1) multiplied by their individual uptake/efflux data (Table 2). The data for glycerol and NEFA correspond exclusively to the adipocytes present in 1 g of tissue, since no efflux of either was observed in NSC or RBC. Statistical significance of the differences between groups (2-way ANOVA): the data for site in adipocytes and NSC are indicated in the Figure itself, the absence of data indicates that the differences, if any, were not significant (P > 0.05); no significant differences were observed for the effect of initial glucose concentration.