
Figure 2.
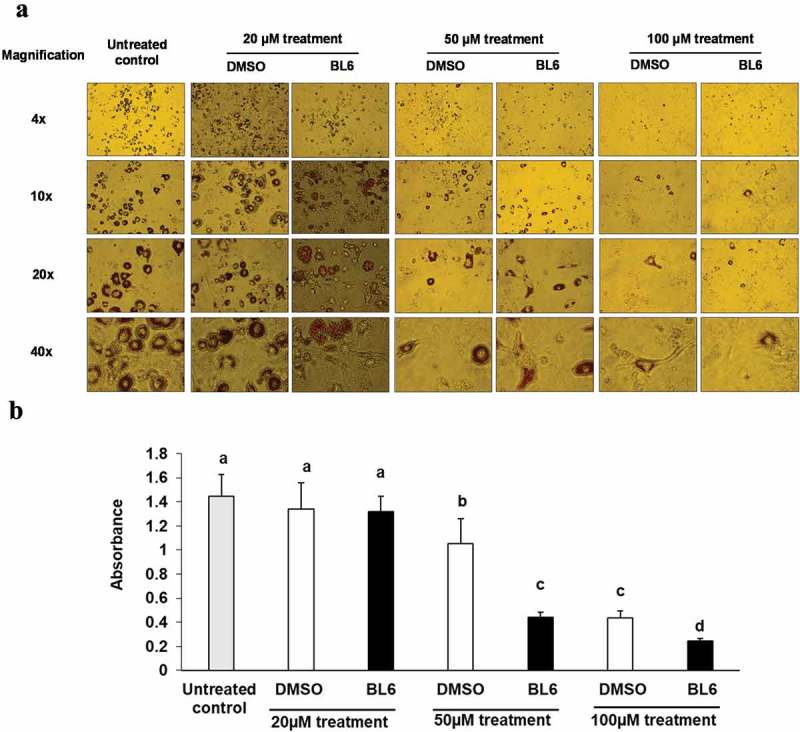
Effect of BL6 on adipocyte differentiation (a) and corresponding Oil Red O staining (b) in cultured 3T3-L1 adipocytes. (a) 3T3-L1 pre-adipocyte cells were treated with 20 µM, 50 µM and 100 µM of BL6 along with MDI for 8 days during differentiation. Block to adipogenesis was visually observed following oil red O staining for lipid. (b) Lipid staining was quantified by measuring absorbance. Y-axis shows absorbance of Oil Red O dye at 510 ηm. Data are presented as average absorbance ± sd (n = 6). The effect of each dose of BL6 was compared to its own DMSO control. Groups sharing different alphabet denote statistical significance (P < 0.05). The experiment was repeated a minimum of three times.