
Figure 5.
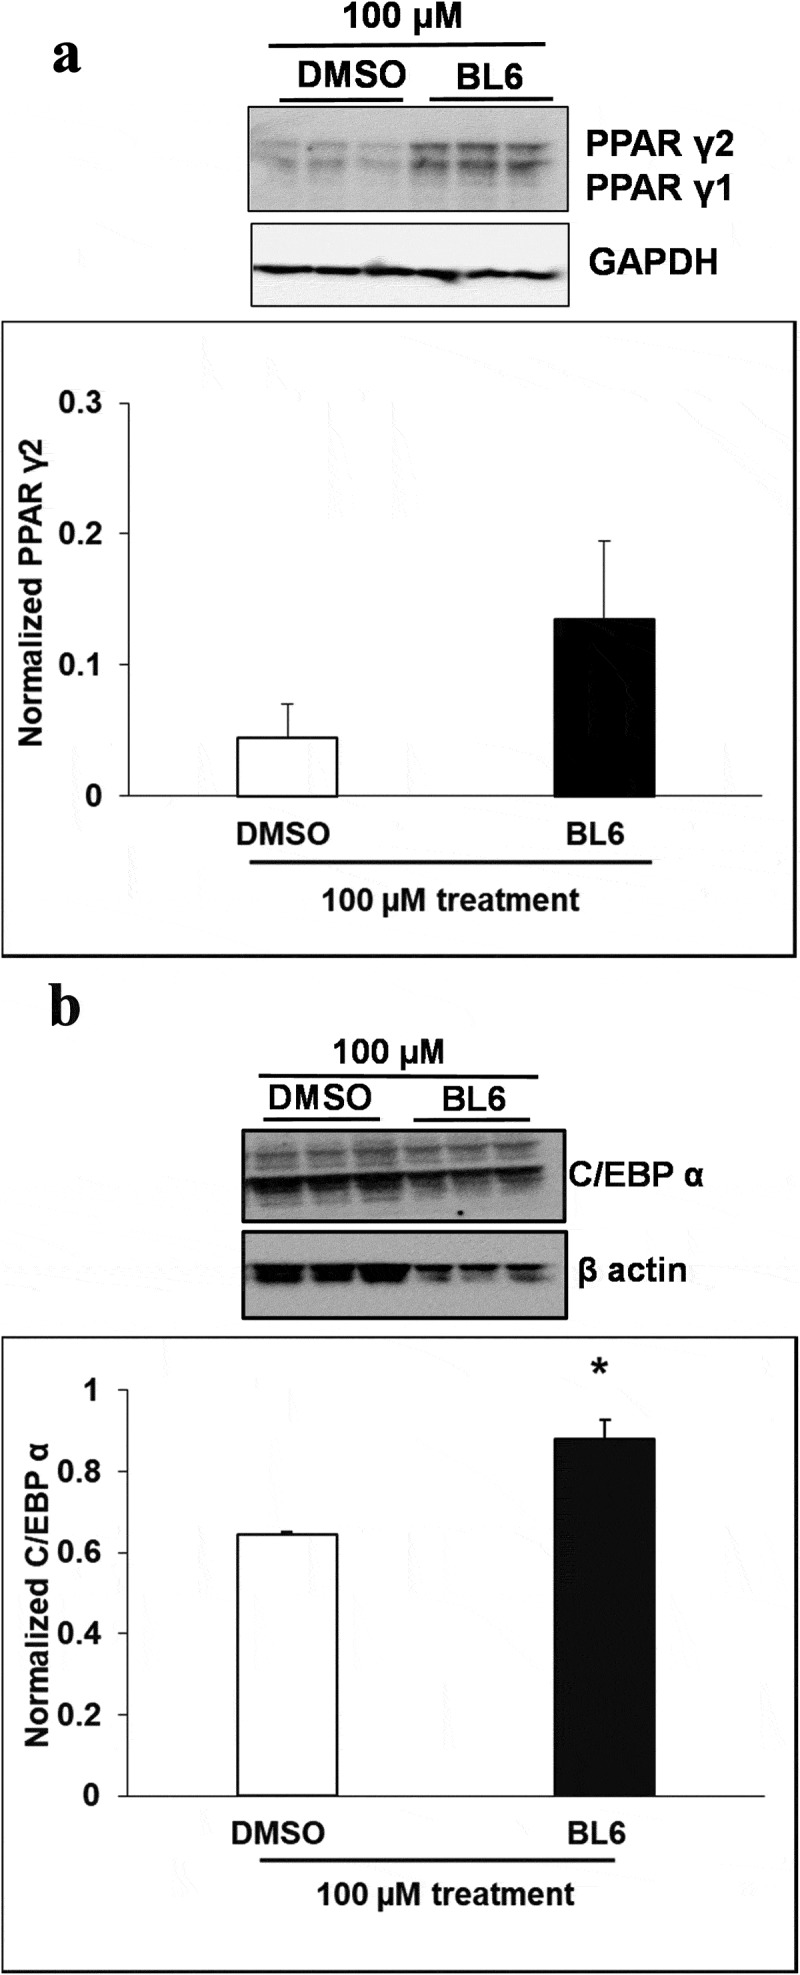
Protein expression of PPARγ, C/EBP α, FASn, adiponectin, pAKT and Glut4 for 100 µM of BL6 treatment along with DMSO control. Protein lysates from 3T3-L1 cells treated with 100 µM BL6 during differentiation were separated on a SDS-PAGE gel, transferred onto a nitrocellulose membrane and immunoblotted with PPARγ, C/EBP α, FAS, adiponectin, pAKT, Glut4, β actin, α tubulin, and GAPDH antibodies. Graphs show average density of protein bands normalized to either GAPDH, β actin or α tubulin. The effect of 100µM BL6 on protein expression was compared to its own DMSO control. Data are presented as average ± sd (n = 3). Statistical significance was determined by Student TTEST (P < 0.05) and shown by asterisks on top of the bar. The experiment was repeated a minimum of three times.