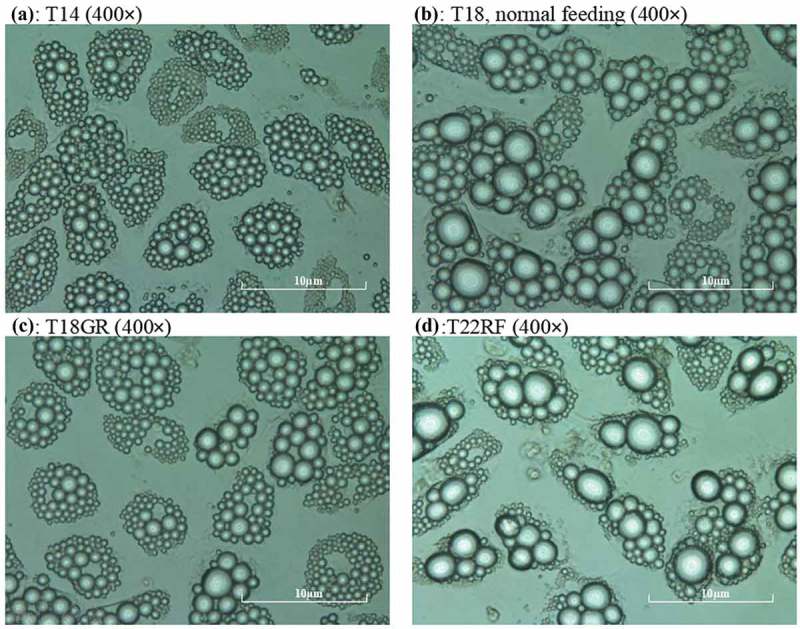
Figure 2.

Recording of mature SGBS adipocytes during the experiment. a: mature adipocytes at time point T14, b: adipocytes at T18, c: adipocytes at T18GR, d: adipocytes at T22RF. a, b, c, d are all shown at 400 × magnification by the microscope camera system. GR: glucose restriction, RF: refeeding.
