Figure 5.

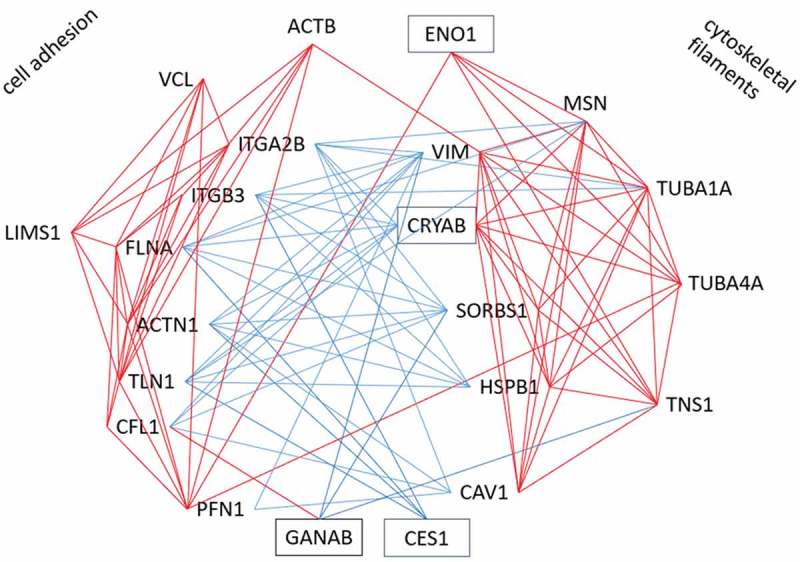
Cluster of significant correlations of CES1, CRYAB, ENO1 and GANAB with adhesome proteins in Yoyo study. Red line indicates significant positive correlation; blue line indicates significant negative correlation.

Cluster of significant correlations of CES1, CRYAB, ENO1 and GANAB with adhesome proteins in Yoyo study. Red line indicates significant positive correlation; blue line indicates significant negative correlation.