
Figure 7.
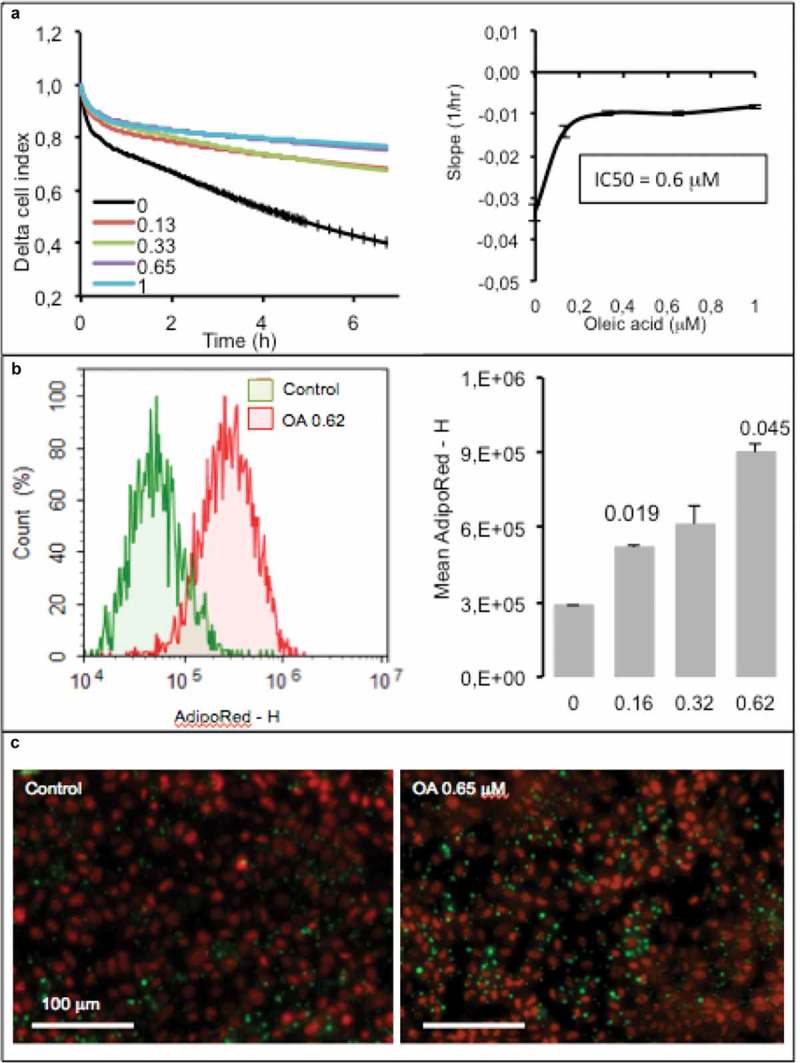
Dose-response of hepatocytes AML12 to oleic acid (OA) after 24 h. (a) Real-time analysis of OA uptake by enterocytes AML12 (left panel) and corresponding slopes and IC50 (right panel). Data are presented as mean values ± SEM (8 replicates). (b) OA-induced TG accumulation monitored by cytometry analysis of AdipoRed fluorescence. Mean AdipoRed-H was analyzed on living cell populations in duplicates (right panel). (c) Merged images of AdipoRed (green) and Hoechst 33258 (red) acquired with identical parameters with objective x20. Significant Student t-test-p-values are reported for p < 0.05, compared to control.