Figure 2.

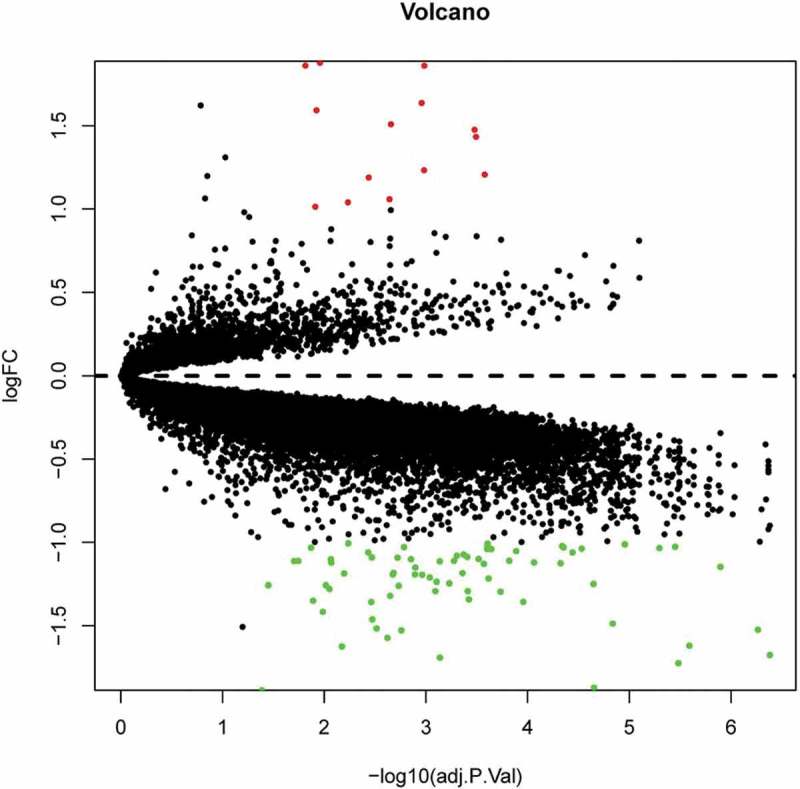
Volcano plot analysis identifies DEGs. Red dots represent 12 upregulated genes and green dots represent 64 downregulated genes in omental adipocyte from IRO subjects compared with ISO subjects.

Volcano plot analysis identifies DEGs. Red dots represent 12 upregulated genes and green dots represent 64 downregulated genes in omental adipocyte from IRO subjects compared with ISO subjects.