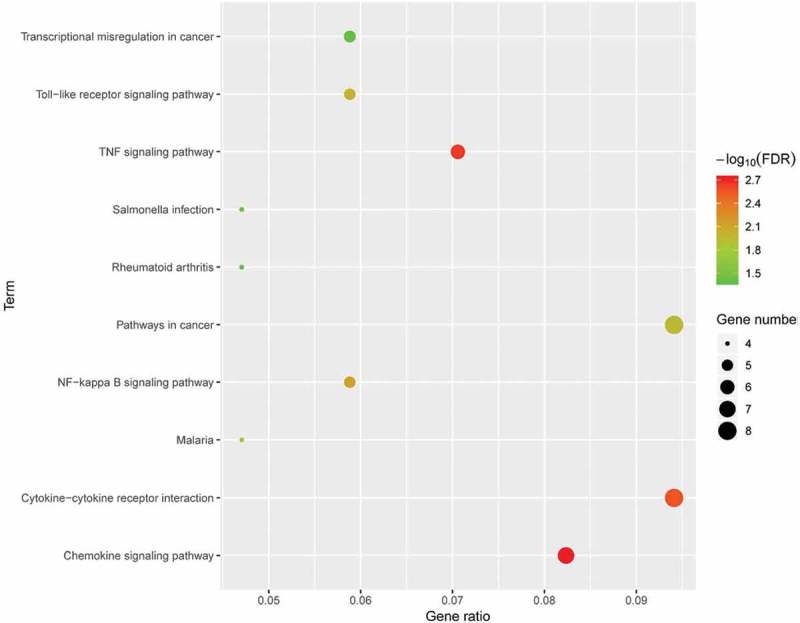
Figure 5.

KEGG pathway analysis of differentially expressed genes. Advanced bubble chart shows enrichment of DEGs in signalling pathways. Y-axis label represents pathway, and X-axis label represents rich factor (rich factor = amount of DEGs enriched in the pathway/amount of all DEGs in background gene set). Size and colour of the bubble represent amount of DEGs enriched in pathway and enrichment significance, respectively. KEGG: Kyoto Encyclopedia of Genes and Genomes; DEG: differentially expressed gene; FDR: false discovery rate.
