Figure 2.

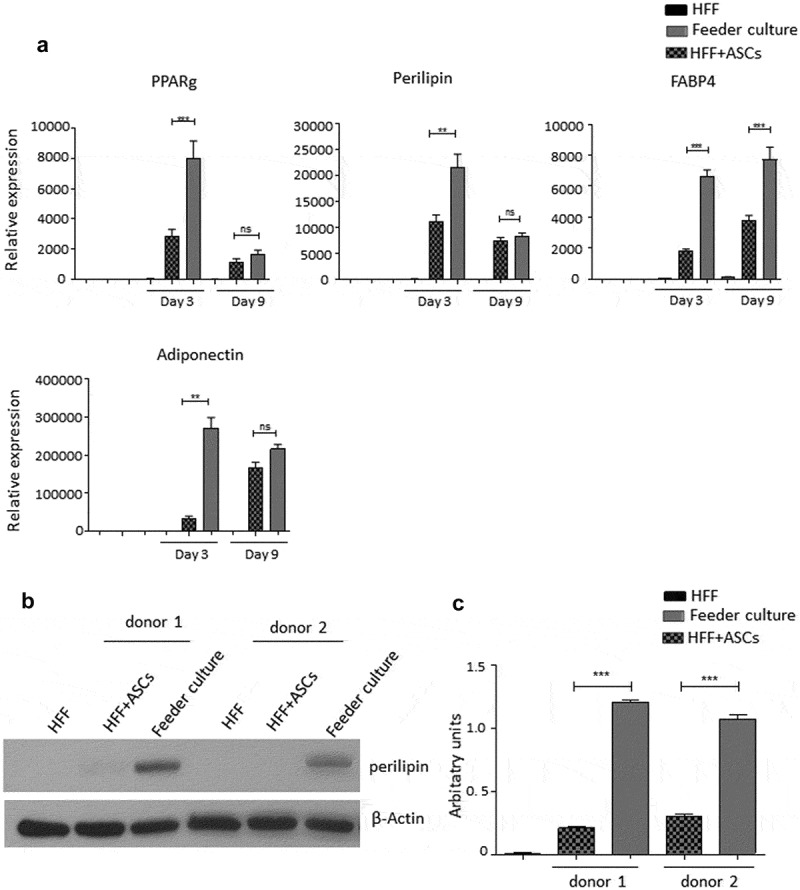
Adipogenic differentiation of human ASCs is enhanced upon feeder with HFFs. Cells were grown according to the scheme shown in Figure 1. Adipogenesis was induced, lysates were prepared and PPARγ2, perilipin, FABP4 and adiponectin mRNA expression was estimated at d 3 and 9 post differentiation. Gene expression before differentiation induction was taken as 1, and fold changes in gene expression were calculated. Graphs are representative of 2 biological repeats (a). Perilipin protein expression was analysed by Western blot, β-actin was used as input control (b). Perilipin and β-actin band intensities were quantified using ImageJ software and ratio of perilipin to β-actin was plotted as arbitrary units (c). All error bars represent the means ± SEM. p* p < 0.05, **p < 0.001 and ***p < .0001. Analysis of variance (ANOVA) is applied for (a) and (c).
