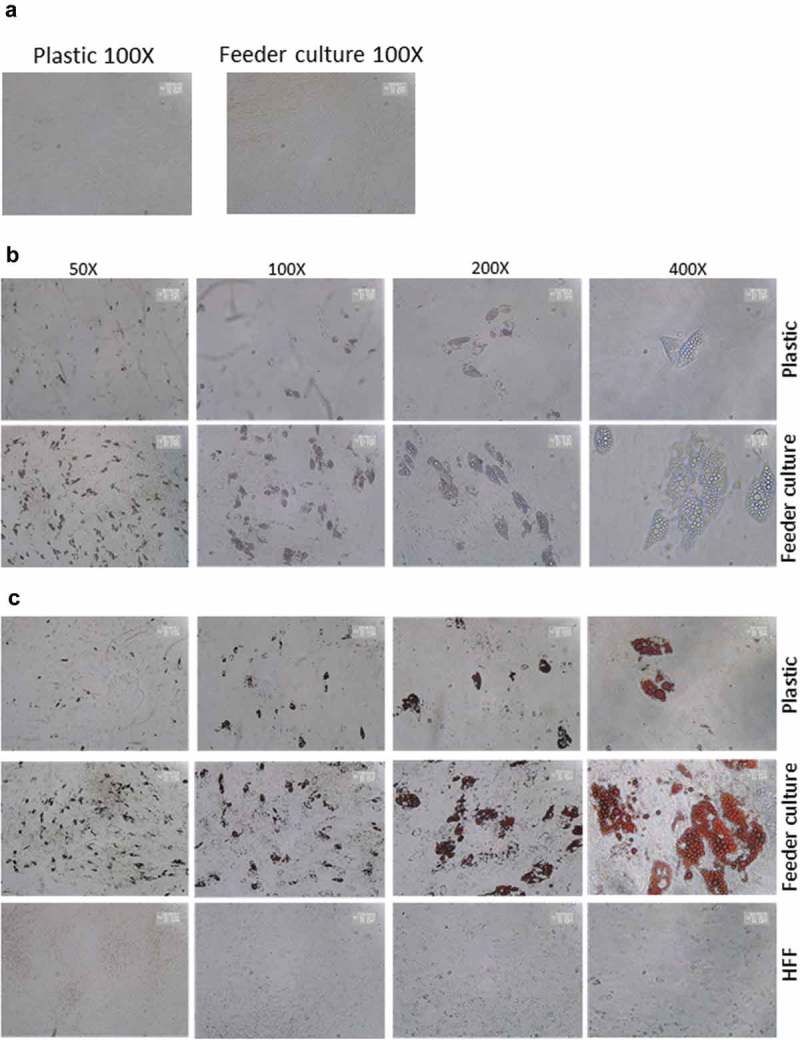
Figure 3.

HFF feeder culture increases adipocyte formation. (a) Light microscopic images of ASCs in pure culture (left) and ASCs in co-culture with HFF feeder (right) are shown. (b) Adipocyte differentiation was induced by hormone cocktail and ASCs in pure culture on plastic dishes and co-culture with HFF feeder were imaged using a light microscope at d 14 post induction of differentiation to estimate the formation of lipid droplets. Representative images from three biological repeats are shown. (c) Accumulation of lipids at d 14 post differentiation was confirmed using Oil-Red-O staining. Representative images from three biological repeats are shown. (d) The number of Oil-Red-O positive cells formed in pure culture on plastic dishes and in feeder culture is indicated. Three biological repeats were employed. (e) The size of fat droplets in formed adipocytes in pure culture on plastic dishes and in feeder culture was measured using ImageJ software and plotted as arbitrary units. Cells from three donors were employed. (f) Oil-Red-O uptake by formed adipocytes in pure culture and feeder culture was quantified by eluting the stain in isopropanol and measuring the absorbance at 518 nm. Graphs are representative of two biological repeats. (g) Feeder culture leads to an enhanced adipogenic differentiation as depicted by whole well image after staining with Oil-Red-O. Images are representative of two biological repeats. (h) D 14 post induction of adipocyte differentiation in pure culture on plastic dishes and in combination with HFFs in feeder culture cells were fixed and stained with LipidTox (green) while nuclei are stained with DAPI (blue), 400× magnification. n = 3. (i) Insulin-stimulated glucose uptake in human ASCs grown on plastic and feeder layer. (Left panel) ASCs were cultured either directly on plastic or on feeder layer until d 14 post induction of differentiation. HFFs alone served as control. After incubation in insulin-free medium for 1 d, cells were stimulated with medium containing insulin. One hour later, 2-NBDG was added for 10 min. The reaction was stopped by washing with PBS, and 2-NBDG uptake was analysed by fluorescence microscopy. N = 3 donors; representative images from one donor are shown. (Right panel) Fluorescence was measured using ImageJ, the mean fluorescence from HFFs was subtracted as background. For quantification, five images per donor were used. All error bars represent the mean ± SEM. *p < 0.05, ** p < 0.001 and ***p < .0001. Analysis of variance (ANOVA) is applied for (F), while Student’s t-test is applied to (d), (e) and (i).
