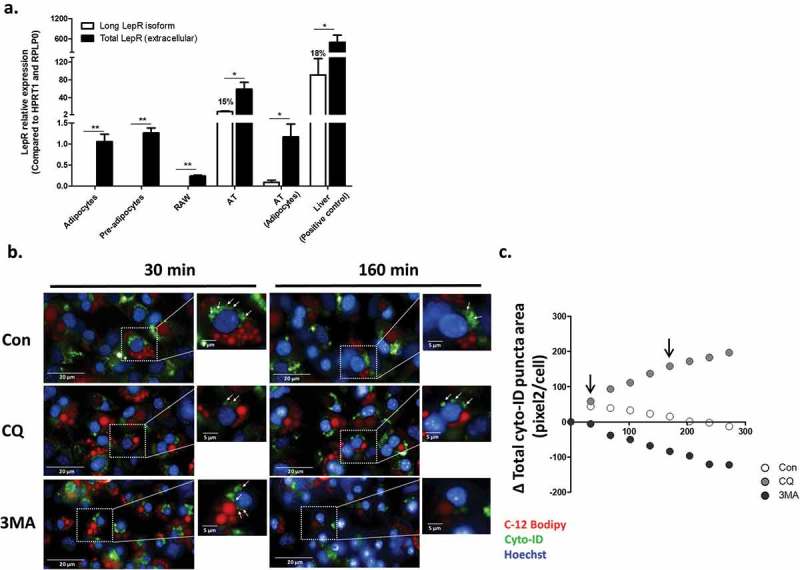
Figure 1.

Leptin receptor isoforms expression and live-cell imaging of autophagosome dynamics in differentiated adipocytes. (a) The expression of total (black bars) and long (ObRb, white bars) LepR isoforms mRNA was measured in murine adipocyte cell-line (pre and after differentiation), RAW264.7 murine macrophages cell-line, mice adipose tissue (whole tissue and adipocytes fraction) and liver (positive control), using primers directed to the extracellular domain or the intracellular domain of ObRb, respectively. Results are presented as fold expression from adipocytes cell line (n = 4). Values are mean ± SEM. Means were compared by Mann-Whitney t-test. *p < 0.05, **p < 0.01. (b) Live-cell imaging (Operetta high throughput imaging system) of differentiated murine adipocyte cell-line stained with CYTO-ID (green) to detect autophagosomes (white arrows), in BODIPY-C12 (red, to stain lipid-droplets) – positive cells, and Hoechst (blue) to stain nuclei. Cells were treated with or without CQ (10 μmol/l) to inhibit autophagosome degradation, or with 3-methyladenine (3MA, 5 mmol/l) to inhibit autophagosome biogenesis. Scale bar, 20 μm and 5 μm in zoomed-in images. Shown are representative images. (c) Quantification of mean total autophagosome area per cell in BODIPY-C12 positive cells over time was done semi-automatically by following CYTO-ID punctae area using Columbus software. Black arrows correspond to the time-points shown in B.
