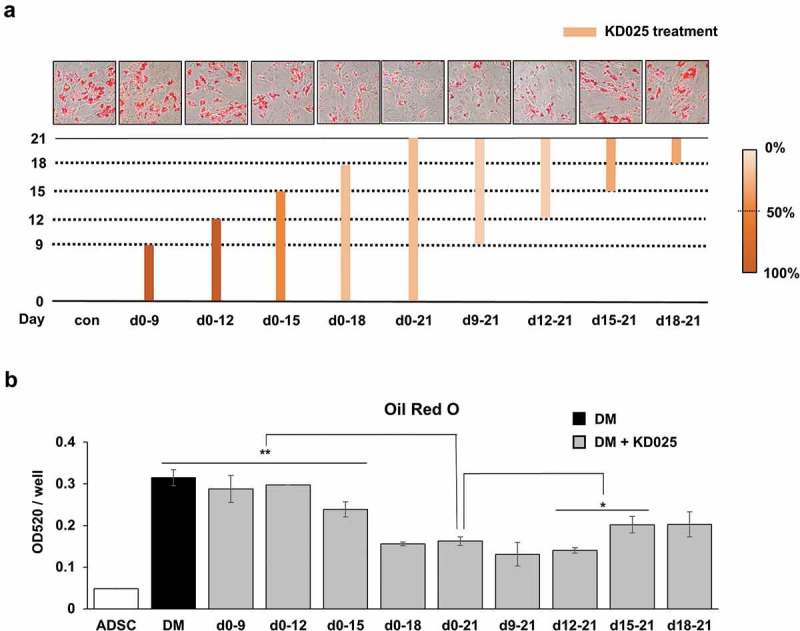
Figure 4.

Stage-specific effect of KD025 on adipogenesis of hADSC.
(a) During differentiation of hADSCs, cells were exposed to 3 μM KD025 at various time schedules as indicated, and stained with ORO. The time schedules of inhibition are denoted as the corresponding rods, and the amount of lipid measured was indicated by the relative darkness of the color compared to DM treated group as 100%.(b) Lipid accumulation was assessed by measuring absorbance at 520 nm. The positive control treated for the entire period (from day 0 to day 21) is marked in orange. *p < 0.05, **p < 0.01 vs. positive control (orange box).
