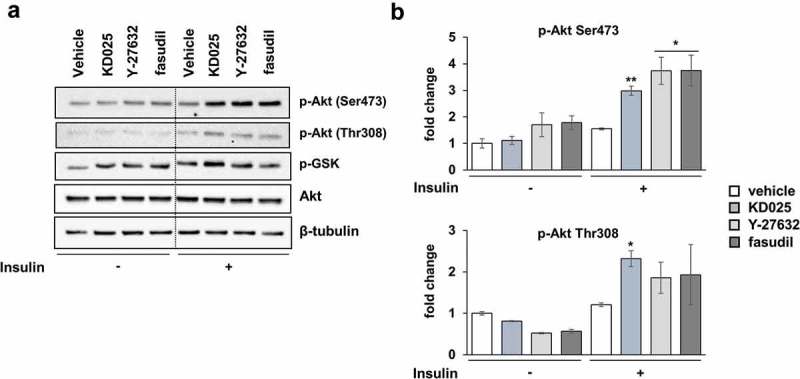
Figure 5.

Effects of ROCK inhibitors on insulin signaling.
hADSCs were starved in serum-free medium and then stimulated with 20 nM insulin for 20 min. ROCK inhibitors were treated during starvation and stimulation periods. Western blot was performed to evaluate the level of p-Akt (Ser473), p-Akt (Thr308), Akt, and p-GSK-3α/β. β-tubulin was used as the loading control. (b) Band intensity of p-Akt (Ser473) and p-Akt (Thr308) was quantified using the Image J software. The relative level was assessed as fold changes compared to the unstimulated, vehicle-treated control cells. *p < 0.05, **p < 0.01 vs. control.
