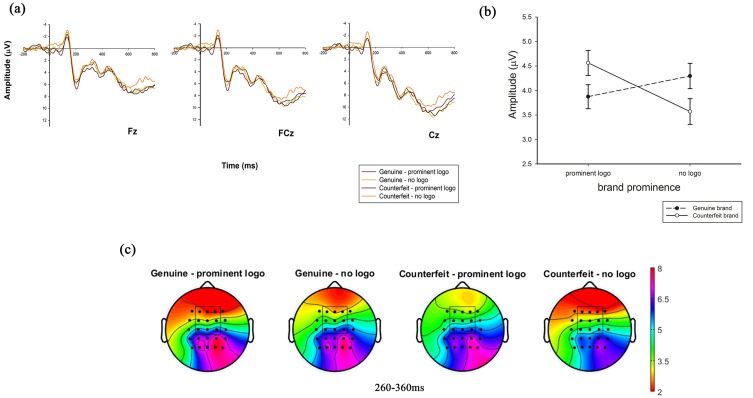
Figure 3.
N200 condition effect. N200 waveforms were averaged from the 20 subjects, and we pooled the data from F1, Fz, F2, FC1, FCz, FC2, C1, Cz, and C2 electrodes. (A) Grand-averaged ERP waveforms in the frontal regions with three electrodes (Fz, FCz, and Cz); (B) Line chart of the mean and standard error of the N200 amplitude across the 2 (prominent logo vs no logo) by 2 (genuine brand vs counterfeit brand) conditions. (C) Topographic maps of four conditions for N200 amplitude. The N200 comparison of the four conditions (genuine brand with a prominent logo, genuine brand without a logo, counterfeit brand with a prominent logo, and counterfeit brand without a logo).

