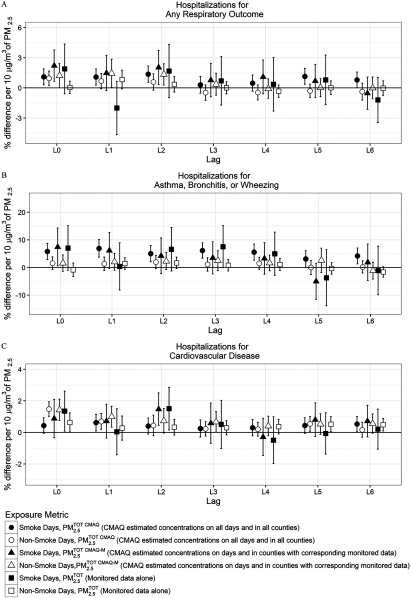
Figure 2.
Percentage difference and 95% confidence intervals in hospitalizations during 2008–2010, among U.S. Medicare recipients y of age per increase in , lag day 0 to lag day 6. Smoke days are defined as having a wildfire-specific contribution , and non-smoke days as wildfire-specific contribution . Associations are estimated using a single lag model for the interaction between (, , or ) and SmokeDay adjusting for day of the week, day [natural spline with 6 degrees of freedom (df) per year], temperature (natural spline with 3 df), and relative humidity (natural spline with 3 df) for each county, followed by a meta-analysis. Using 595 counties, 341 counties, and 607 counties were used in the meta-analyses for (A) respiratory; (B) asthma, bronchitis, and wheezing; (C) and cardiovascular hospitalizations, respectively. Using the other metrics ( or ) 134 counties, 92 counties, and 137 counties were used in the meta-analyses for (A) respiratory; (B) asthma, bronchitis, and wheezing; (C) and cardiovascular hospitalizations, respectively. The y-axes limits differ between hospitalization types. (See Table S1 for corresponding numeric data.)

