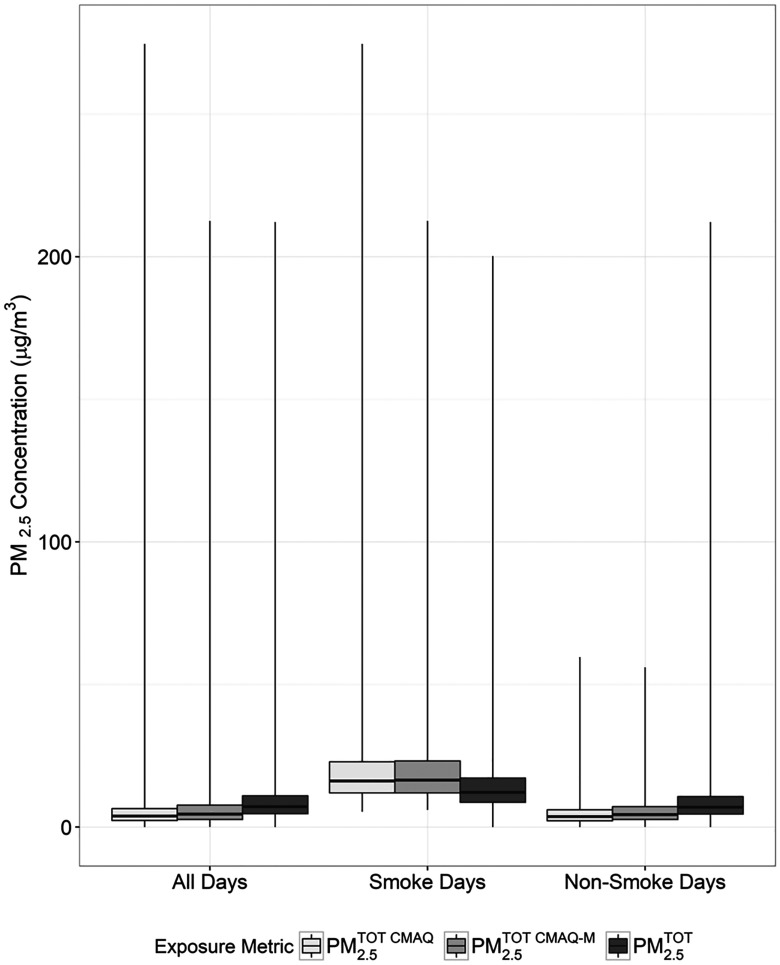
Figure 3.
Summary of concentrations (), overall and by smoke and non-smoke days. : CMAQ estimated concentrations on all days and in all counties, : CMAQ estimated concentrations on days and in counties with corresponding monitored data, : Monitored data alone. Smoke days defined as wildfire-specific contribution and on-smoke days defined as wildfire-specific contribution . The horizontal line within each box represents the median, whereas the ends of the box correspond to the 25th and 75th percentiles. The lines extending from the box correspond to the minimum and maximum. (See Table S2 for corresponding numeric data.)

