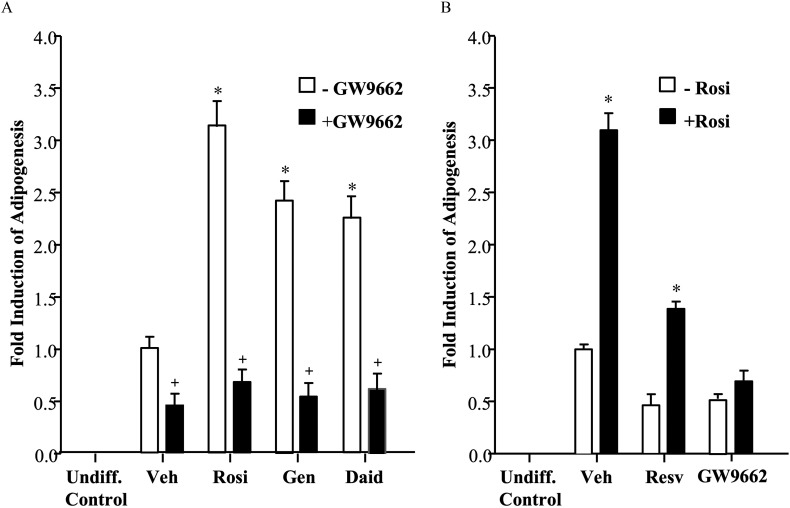
Figure 4.
Adipocyte differentiation in the presence of agonist rosiglitazone or phytoestrogens with or without the antagonist GW9662. Adipocyte differentiation assays: 3T3L1 mouse pre-adipocytes were grown to confluence and then induced to differentiate. After 8 d, cells were assayed for adipogenesis using a quantitative fluorescent assay (AdipoRed™ Adipogenesis Assay Reagent). Cells were co-stained with nuclear dye Hoechst 33342, and lipid accumulation values were calculated between treatments by normalizing lipid intensity values to Hoechst intensity. Graphical values for each treatment represent comparison with Vehicle (set at 1). Each data point is the average of three independent experiments; individual experiments included four technical replicates used for each treatment. An undifferentiated control (Undiff. Control) sample is included for comparison. (A) Cells were co-incubated with vehicle (Veh) or agonist Rosiglitazone (Rosi), Genistein (Gen), or Daidzein (Daid) in the absence or presence of antagonist GW9662 during the entire differentiation period with the media replaced every 2 d. Bars represent . * for comparison between Veh and each treatment. + for comparison between each treatment alone and each . (B) Cells were co-incubated with vehicle (Veh) Resveratrol (Resv), or GW9662 in the absence or presence of Rosiglitazone (Rosi) during differentiation, and assayed as described above. Bars represent . * for comparison between each treatment and each .

