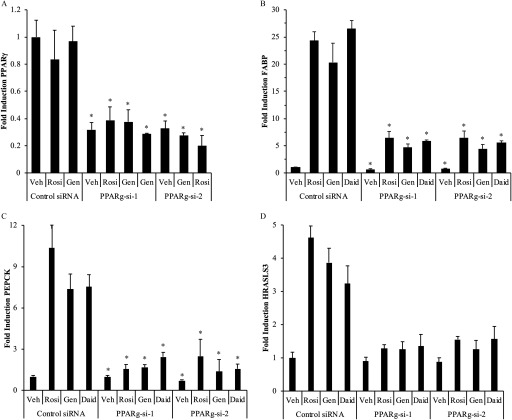
Figure 6.
target gene expression in 3T3L1 cells following siRNA reduction in expression and treatment with agonist rosiglitazone or phytoestrogens. (A) siRNA reduction in expression in adipocytes. 3T3L1 cells were induced to differentiate for 7 d; differentiation was confirmed by staining with Oil Red O. Differentiated cells were treated for 48 h with siRNA duplexes targeting murine and ( and ) or a control nontargeting siRNA duplex (Control si-RNA). Cells were then treated with ligands for 24 h, total RNA was harvested, and cDNA was prepared and used for gene expression analysis. The expression of (B) FABP, (C) PEPCK, and (D) HRASLS3 in 3T3L1 differentiated adipocytes was evaluated by real-time PCR. 3T3L1 cells were induced to differentiate for 7 d and treated with siRNAs as described above. After 48 h, cells were treated for 24 h with vehicle (Veh) or Rosiglitazone (Rosi), Genistein (Gen), or Daidzein (Daid), or Resveratrol (Resv). Total RNA was harvested, and cDNA was prepared and used for gene expression analysis. Each data point is the average of at least three independent experiments; individual experiments included three technical replicates used for each treatment. Bars represent . For A: * for comparison between the Veh-treated Control si-RNA sample and the and samples for all treatments. For B–D: * for comparison between each siRNA and each or .

