Figure 2.

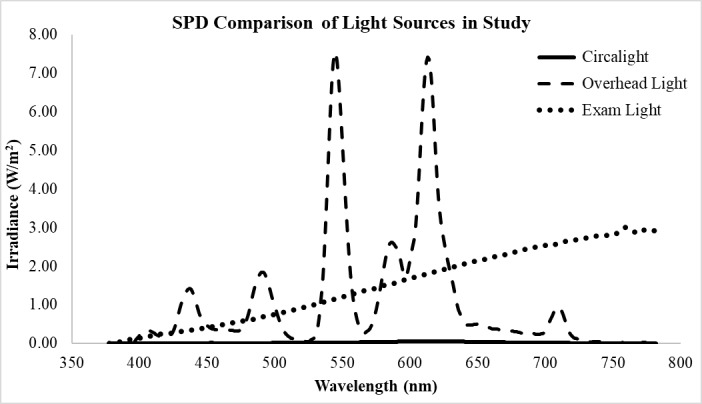
Spectral power distribution (SPD) of different light sources in the patient room studied in the authors’ hospital. Note: the circalight curve is almost not visible at this scale.

Spectral power distribution (SPD) of different light sources in the patient room studied in the authors’ hospital. Note: the circalight curve is almost not visible at this scale.