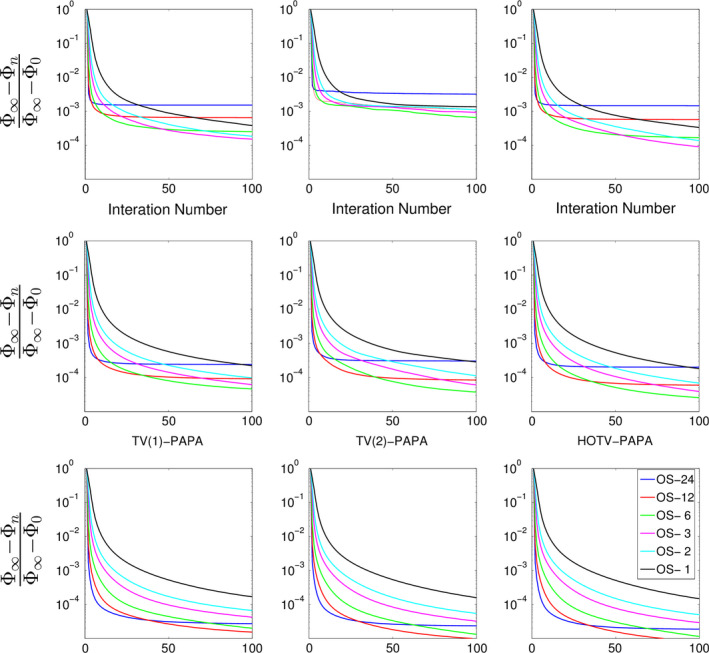
Figure 5.

Normalized difference of the objective function as a function of iteration for different numbers of subsets for the simulated Sinc+ phantom are shown. Ordered subset convergence rates are shown for top: low‐ ID ( ID = 5, antibody imaging) convergence rates, middle: medium‐ ID ( ID = 25, whole body imaging) convergence rates, bottom: high‐ ID ( ID = 125, brain imaging) convergence rates. Left to right the figure shows first‐ and second‐order TV and HOTV‐PAPA for each count number. [Color figure can be viewed at wileyonlinelibrary.com]
