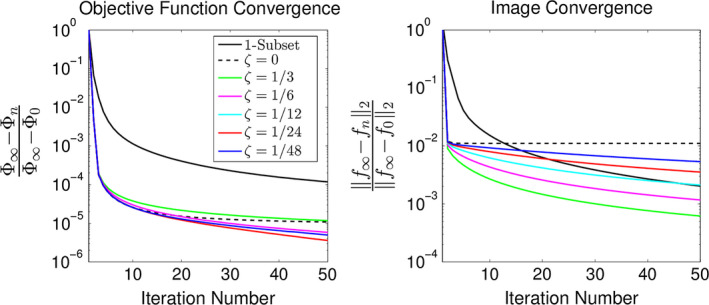
Figure 9.

The convergence of the brain patient shown in Fig. 1(a) using 24 subsets using the normalized relative difference of both the objective function (left plot) and images (right plot) are compared using different amounts of relaxation. The left plot () shows that objective function convergence is fastest using a relaxation constant between one twenty‐fourth and one‐twelfth. This plot also shows the convergence of the non‐OS reconstruction. The right plot () shows that unrelaxed OS causes the images to stop converging despite the objective function continuing to decrease (see left plot). For assured convergence, it is necessary for both normalized relative differences to continue to decrease. [Color figure can be viewed at wileyonlinelibrary.com]
