
Figure 3.
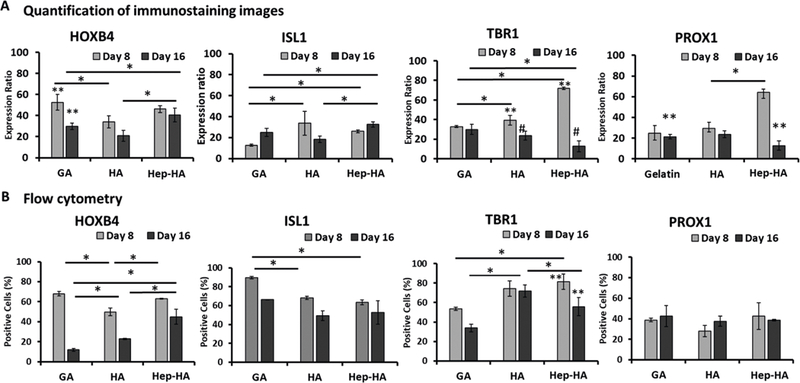
Stage-dependent impact of ECMs on neural tissue patterning of hiPSCs. The cells treated with ECMs at both day 8 and day 16 were compared for forebrain and hindbrain marker expression. (A) Quantification of marker expression using the ImageJ software for immunostaining images (n = 3). (B) Flow cytometry analysis of forebrain markers (TBR1, PROX1) and hindbrain markers (HOXB4, ISL1) at day 21 (n = 3). *, **, and # indicate p < 0.05 (two-way ANOVA, see Supporting Information Table S3).