
Figure 6.
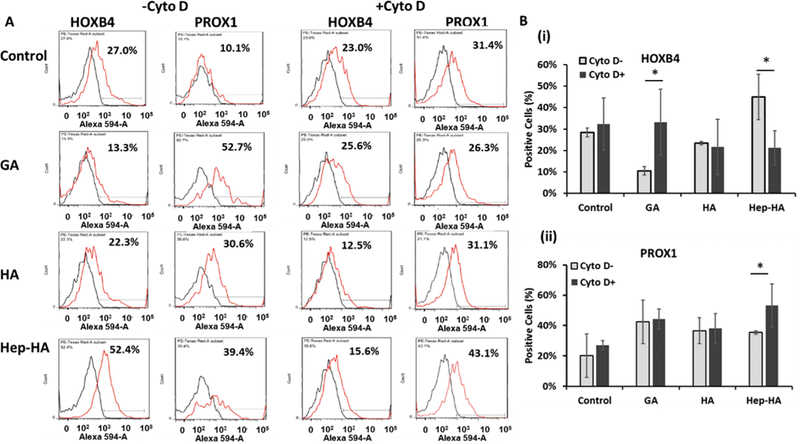
Effects of cytochalasin D treatment on neural patterning of ECM treated-hiPSCs. The cells treated with ECMs and ± cyto D at day 16 were analyzed for forebrain and hindbrain markers. (A) Representative flow cytometry histograms of forebrain marker (PROX1) and hindbrain marker (HOXB4) at day 20 under ± cyto D. Black line, negative control; red line, marker of interest. (B) Expression of (i) hindbrain marker HOXB4 and (ii) forebrain marker PROX1 at day 21 under ±cyto D quantified by flow cytometry (n = 3). Control indicates Geltrex conditions. * indicates p < 0.05 (two-way ANOVA, see Supporting Information Table S3).