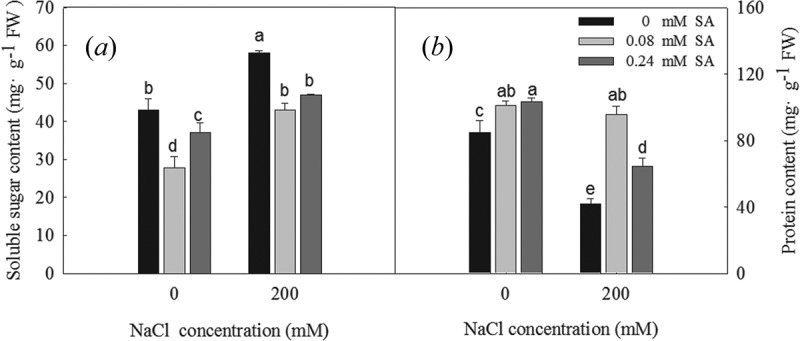
Figure 4.

Soluble sugar content (a) and total protein content (b) of L. bicolor seeds after 2 days of treatment with different concentrations of SA (0, 0.08, 0.24 mM) under 0 and 200 mM NaCl. Values are means ± SD of three replicates (n = 3). Bars with the different letters are significantly different at P < .05 according to Duncan’s multiple range tests.
