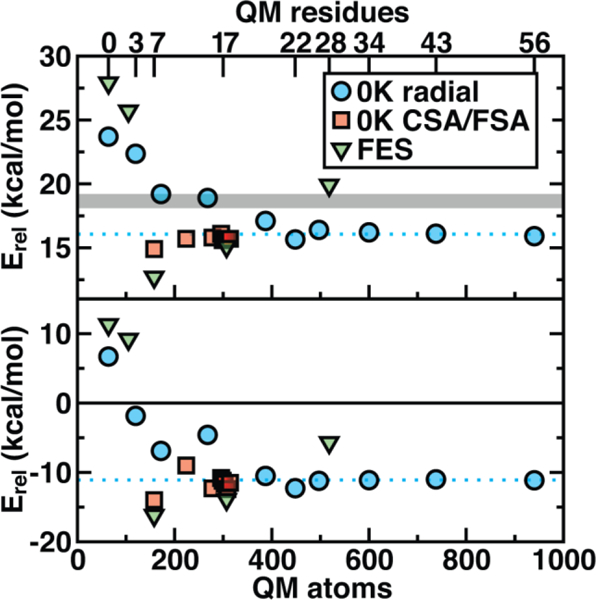
Figure 2.

Barrier heights (top) and reaction energies (bottom) in kcal/mol for methyl transfer in COMT versus the number of atoms in the QM region obtained three ways: 0 K QM/MM properties from radially increasing distance cutoffs (blue circles, from Ref. 35), systematically constructed regions (red squares, from Ref. 62) and 300 K QM/MM free energy dynamics (green triangles, from Ref. 34). (top) ΔG‡ at 300 K or the 0 K Ea with the experimental ΔG‡ range126–127 indicated as a gray shaded region that should only be compared to the green triangles. (bottom) ΔGrxn at 300 K or the 0 K ΔErxn. In both plots, the asymptotic limit from the average of the three largest 0 K radial QM regions is shown as a blue dotted line and should only be compared to the blue circles and red squares. Approximate protein residue counts for each QM region size are labeled on the x-axis at top.
