
Figure 3.
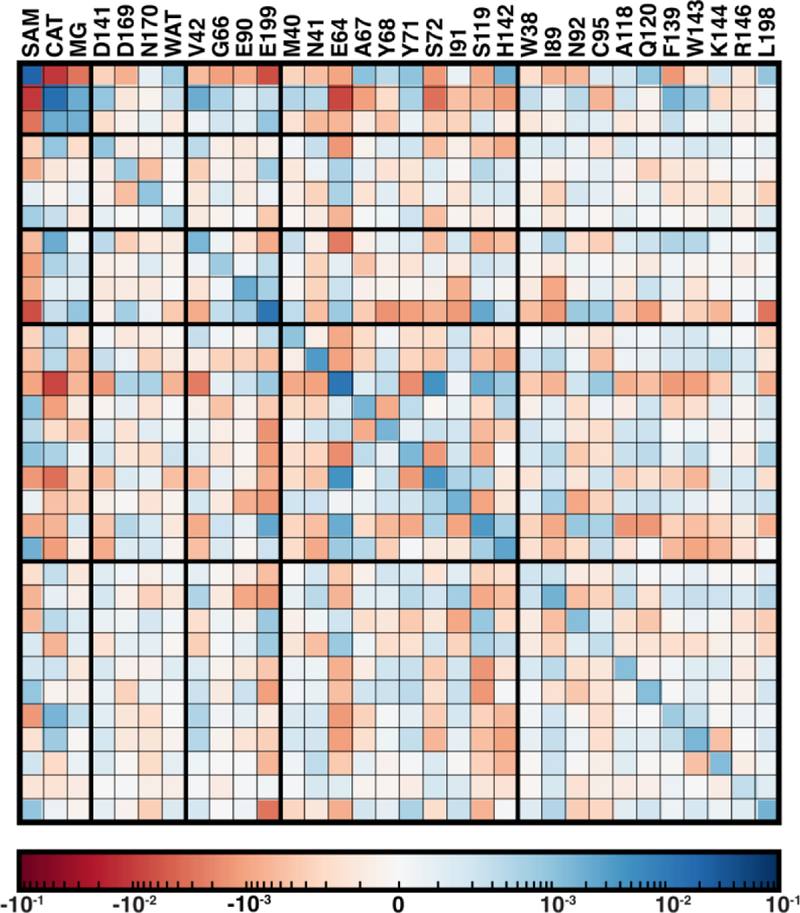
Covariance matrix of Mulliken partial charges over 200 ps of QM/MM dynamics across the COMT methyl transfer reaction coordinate colored on a symmetric logarithmic scale according to inset colorbar (positive in blue, zero white, and red negative). The diagonal represents the variance of charges for each residue. Residues are annotated by their single letter code and residue number at top because the matrix is symmetric. Thick lines correspond to the QM region in which a residue or substrate first appears, and residues are ordered by sequence within each QM region grouping, as described in the main text.