
Figure 9.
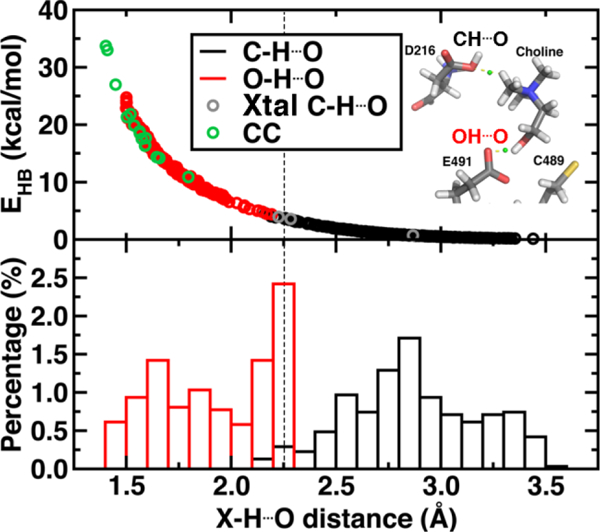
(top) Hydrogen bond energy (EHB, in kcal/mol) versus X-H…O distance for i) snapshot MD distances with X=O (red circles), X=C (black circles), ii) all observed close contacts in crystal structures (CC, green circles), and the X=C non-covalent interactions observed in CutC (Xtal C-H…O, gray circles). A snapshot showing the C-H…O and O-H…O hydrogen bond is provided in inset with the BCP shown as a green sphere. (bottom) Normalized distribution of CH…O and OH…O distances from MD snapshots as described for the top pane. A qualitative cutoff between CH…O and OH…O distances is indicated by a vertical dashed line at 2.25 Å.