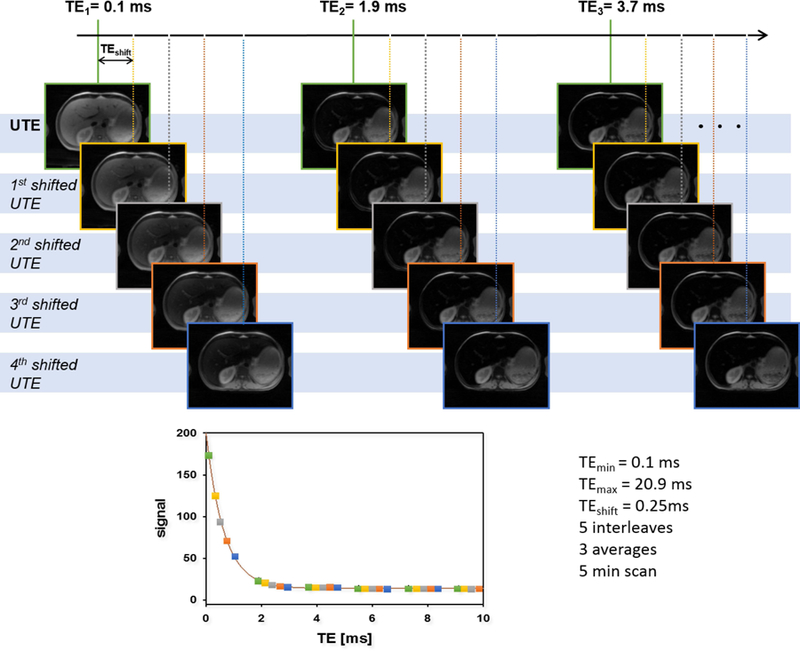
FIG. 1.

Schematic description of the UTE-A acquisition with respective measurement parameters in vivo. The full data set is acquired in 5 interleaves, each interleave containing 12 echoes and shifted by ΔTEshift = 0.25 ms from each other. The entire scan has been repeated 3 times to increase SNR. This results in a typical signal decay as shown in the bottom. Images acquired in each interleave are represented by a distinct color (green, yellow, grey, orange and blue). To study the impact of ΔTE on accuracy and precision, every other echo (yellow & orange) has been removed. For investigation of the impact of TEmax, the last echoes have been sequentially removed to create echo trains with lengths of 60 (all data, TEmax = 20.9 ms), 30 (TEmax = 10.1 ms), 15 (TEmax = 4.7 ms) and 7 (TEmax = 2.1 ms). Finally, for SNR related simulations all 60 echoes and number of averages (NA) = 1, 2, 3 were used.
