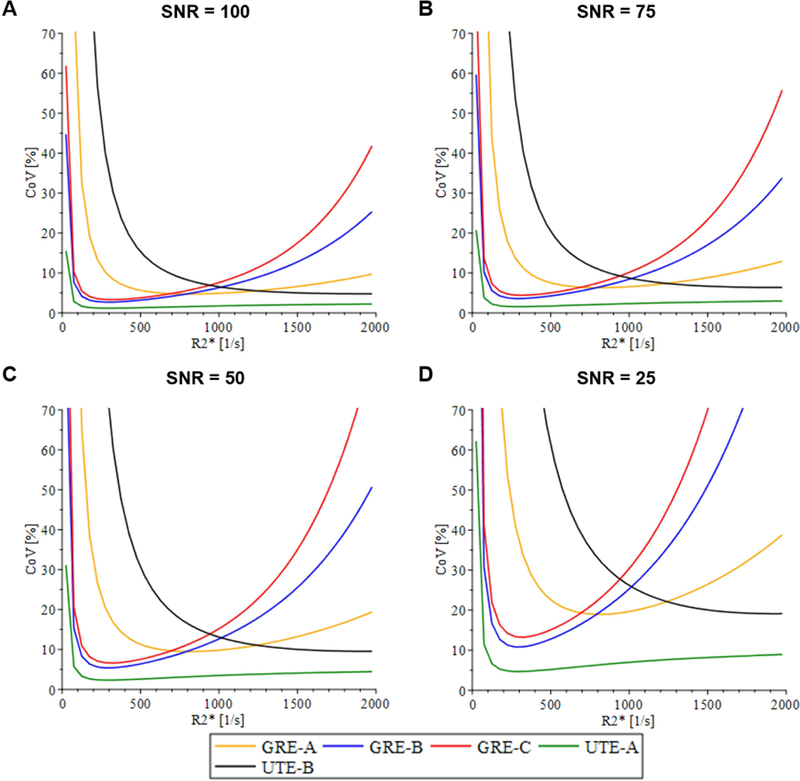
FIG. 2.

Coefficient of variance (CoV) plots for acquisition methods listed in Table 1, independent of the signal model under different signal-to-noise ratio (SNR) conditions. For high R2* values (>1000 s−1), all GRE acquisition methods had low precision whereas UTE acquisition methods had high precision. This demonstrates that TEmin affects precision for the high R2* range. In the low R2* range, acquisitions that used longer TEmax (GRE-B, GRE-C, UTE-A) had higher precision than did GRE-A and UTE-B, which used relatively much shorter TEmax. This indicates that TEmax affects precision for low R2* values. As SNR decreased, all acquisitions showed a decrease in precision, indicating that SNR affects the overall precision.
