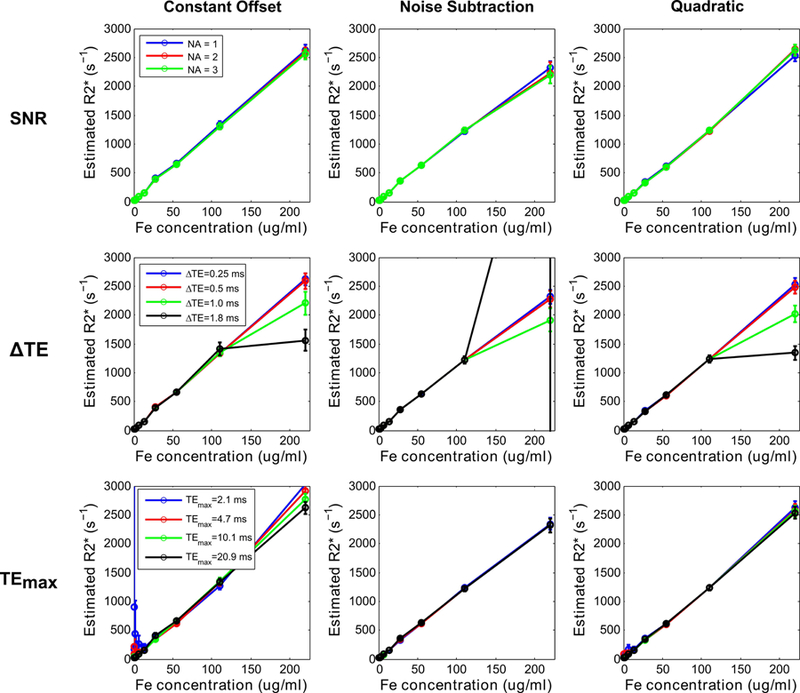
FIG. 6.

Mean R2* values (error bars denote standard deviation) obtained using 3 signal models plotted against iron concentrations in phantoms. UTE-A acquisition was taken as the reference, and parameters: SNR (top row), ∆TE (middle row), and TEmax (bottom row) were varied. SNR was compared by varying the number of averages (NA). All models produced similar R2* values for different NA and underestimated or overestimated R2* for the highest iron concentration obtained using longer ∆TEs (≥1ms). For low iron concentrations and shorter TEmax (2.1, 4.7ms), the constant offset model substantially overestimated R2* values, the quadratic model only slightly overestimated, whereas the noise subtraction model still produced accurate results.
