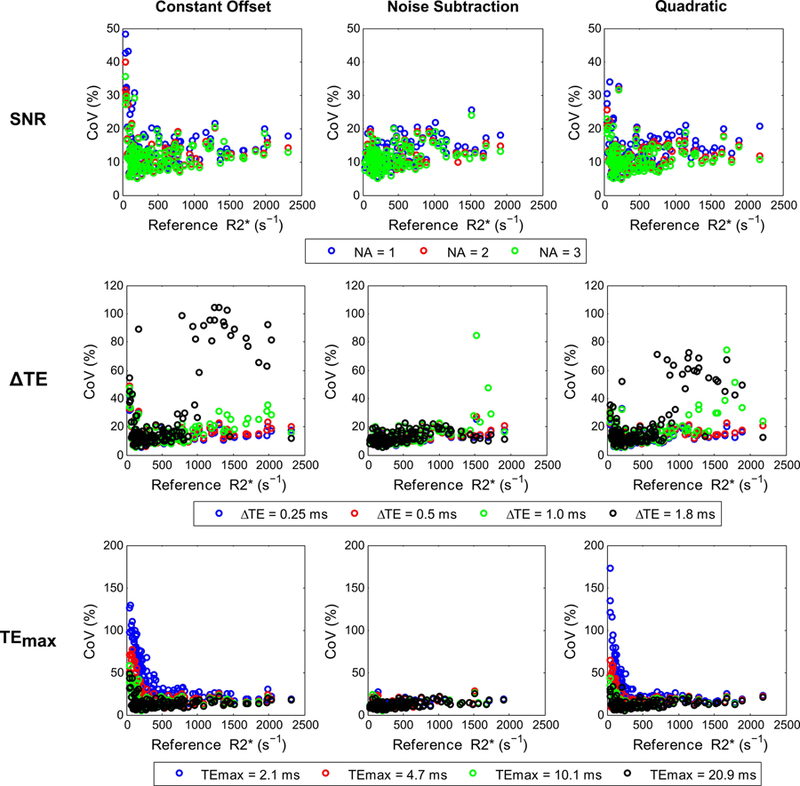
FIG. 8.

Comparison of CoV in R2* values calculated with different fits by varying UTE-A acquisition parameters: SNR (top row), ∆TE (middle row), and TEmax (bottom row). For each fit, the CoV of R2* values are plotted against reference R2* values calculated with the 3-average UTE-A acquisition. SNR was compared by varying the number of averages (NA). The CoV in R2* values was similar for NA = 2, 3 but was slightly higher for NA = 1 for all model fits. Similarly, the CoV was similar for shorter ∆TEs (0.25, 0.5 ms) but higher for longer ∆TEs (≥1ms) in cases of high iron overload (R2*>1000 s−1). Using longer TEmax (10.1, 20.9 ms) yielded similar CoV in R2* values for all models, but using shorter TEmax (2.1, 4.7ms) yielded high CoV in R2* values for constant offset and quadratic models for cases of mild iron overload (R2*<250 s−1) whereas the noise subtraction model produced CoV similar to that using longer TEmax.
