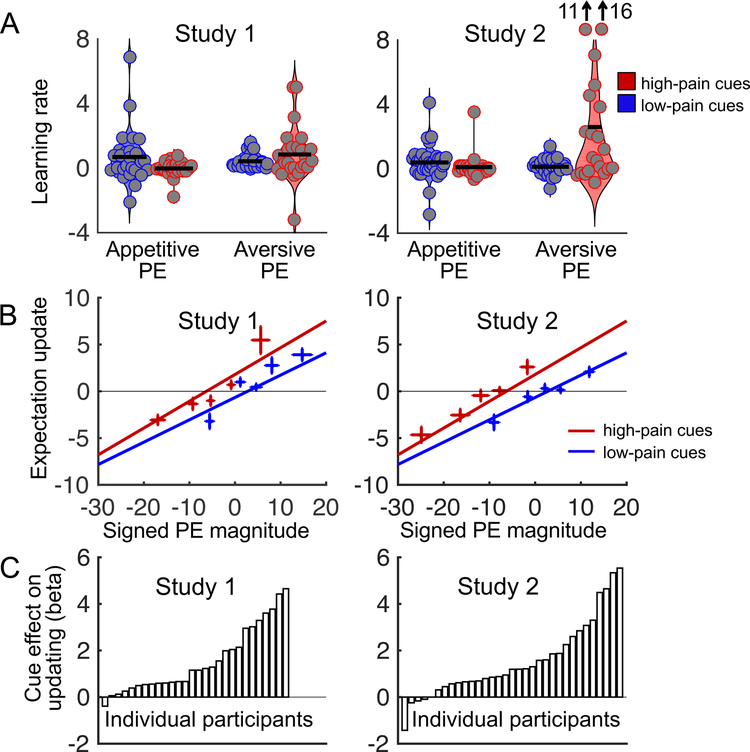
Figure 4.
Confirmation bias in expectation updating. A. Estimated learning rate as a function of prediction error sign and cue type in each study. PE = prediction error. The grey dots indicate individual participants, and the horizontal black lines are the mean values in each condition. The two individual data points at the top of the last condition (learning rates for aversive prediction errors on high-cue trials) in Study 2 fall outside the range of the figure; estimated learning rates for these points are 11 and 16. For Study 1, the first three conditions include data from 28 participants, and the last condition includes data from 26 participants. For Study 2, the first three plots include data from 33 participants, and the last plot includes data from 21 participants. Fewer participants contributed to the last condition because some participants never experienced aversive prediction errors on high-cue trials. B. Expectation updating as a function of signed prediction error magnitude and cue type in each study. Negative and positive prediction errors indicate lower- and higher-than-expected pain, respectively. Negative and positive expectation updates indicate decreases and increases in pain expectations, respectively. We sorted each participant’s low- and high-cue trials into five bins according to signed prediction error magnitude, and plotted the group-mean signed expectation updates for each bin. Lines show linear fits to unbinned single-trial data. Note that there was a significant main effect of cue type but no significant interaction between prediction error and cue type. Plots for Study 1 and 2 are based on data from 28 and 33 participants, respectively. Error bars indicate between-subject standard errors. C. Effect of cue type on expectation updating in each participant (first-level regression coefficients).

