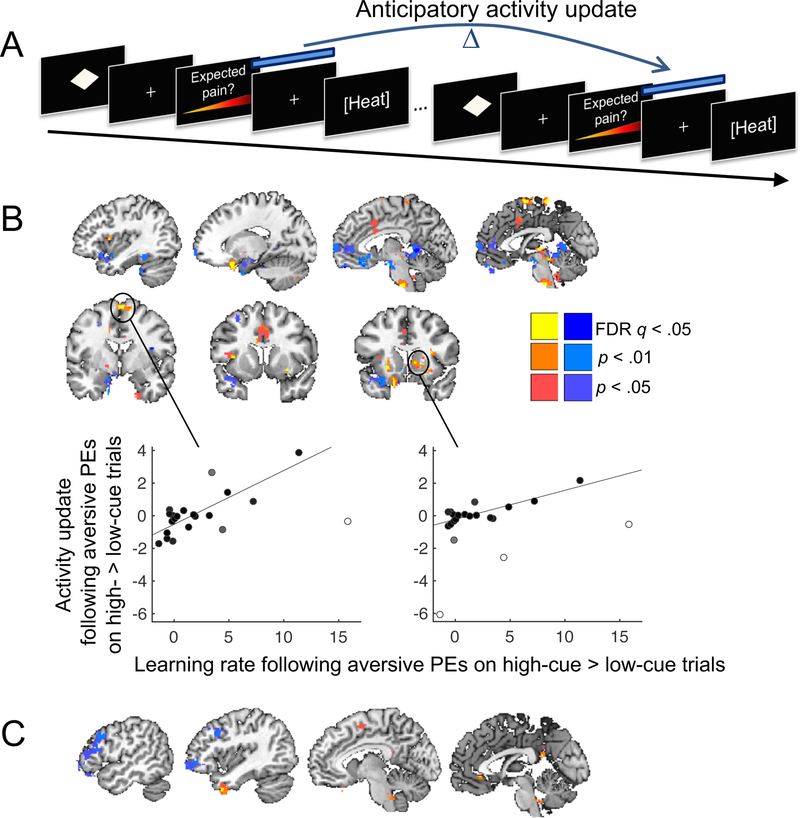
Figure 7.
Confirmation bias in the updating of pain-anticipatory brain activity. A. We computed the change in anticipatory activity across successive trials in which the same cue was presented, separately for trials with higher- and lower-than-expected pain (aversive and appetitive prediction errors, respectively), and tested for effects of cue type. B. Individual differences in confirmation bias on estimated learning rate predict participants’ confirmation bias on anticipatory activity updating following aversive prediction errors. Yellow/red colors indicate positive across-subject correlations between increases in anticipatory activity following aversive prediction errors on high- vs. low-cue trials and estimated learning rate following aversive prediction errors on high- vs. low-cue trials. Blue colors indicate negative correlations. Cluster statistics can be found in Supplementary Table 2. Scatterplots illustrate the correlations in sensorimotor cortex and right striatum. The shading of the points is proportional to each observation’s weight in robust regression; white dots indicate outliers down-weighted by the algorithm. C. Individual differences in confirmation bias on estimated learning rate predict participants’ confirmation bias on anticipatory activity updating following appetitive prediction errors. Yellow/red colors indicate positive across-subject correlations between increases in anticipatory activity following appetitive prediction errors on low- vs. high-cue trials and estimated learning rate following appetitive prediction errors on low- vs. high-cue trials. Blue colors indicate negative correlations. All colored regions were significant at q < 0.05, FDR-corrected. For display purposes, we show the extent of results surrounding FDR-corrected peaks at p < .01 and p < .05 uncorrected. Cluster statistics can be found in Supplementary Table 3. Figures 7B and C are based on data from 21 participants.

