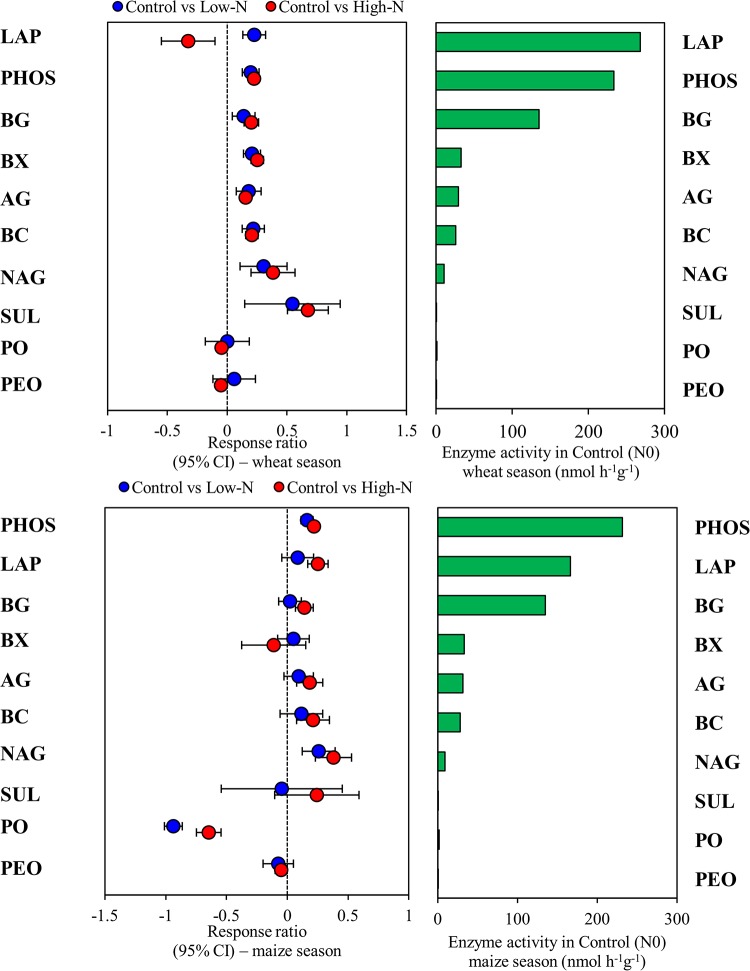
Fig 2. Significantly altered enzyme activities in wheat and maize season following N fertilization as measured by the response ratio method at the 95% confidence interval.
Error bar symbols plotted to the right of the dashed line indicates that the enzyme activities increased, while those at the left side decreased. See Table 1 for abbreviations. Horizontal bars indicates enzyme activities in control.

