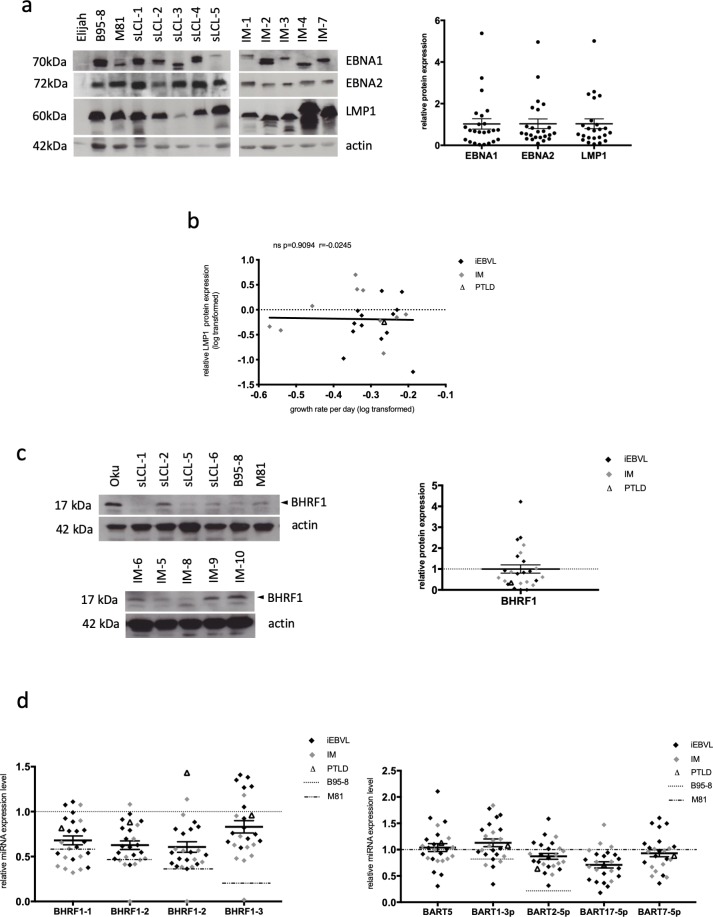
Fig 3. Latent protein and viral miRNA expression in spontaneous LCLs from patients with IM and iEBVL.
(a) The figure shows the results of a western blot analysis that was performed on the panel of sLCLs with antibodies specific for EBNA1, EBNA2 and LMP1. Antibodies specific to actin were used as a loading control. Elijah served as an EBV-negative control. We quantified the protein signals using the ImageJ software. Signals were first given normalized to actin and then to the mean of the obtained values. Mean and standard error of protein expression levels are given in a dot plot. We show as an example the expression pattern in a subset of sLCLs from 10 IM (IM-1 to IM-4 and IM-7) and transplant recipients (sLCL-1 to sLCL-5), as well as in B-cells from a single individual infected with B95-8 or M81. (b) The graph shows the correlation coefficient between the growth rate of the investigated sLCLs and LMP1 protein expression levels. The values of the growth rates have been log-transformed to obtain a normal distribution. (c) Western blot analyses and protein signal quantification were performed for the BHRF1 protein. Signals were first given normalized to actin and then to the mean of the obtained values. Mean and standard error of protein expression levels are given as dot plot. The picture shows the results of the analysis on a subset of cell lines. The Oku cell line served as positive control as it is known to express high levels of this protein. (d) We measured the expression level of the four members of the BHRF1 miRNA cluster and of five members of the BART miRNA clusters using stem-loop RT-qPCR in all cell lines from patients with either iEBVL or IM. We also included the LCLs infected with M81 or B95-8 as controls. The dot plots summarize the expression levels relative to those observed in cells infected with B95-8 for the BHRF1 miRNA expression and relative to M81-infected cells for the BART miRNAs. We also indicated the average miRNA expression levels and standard error of the mean.

